Ethereum
 Hyperliquid
 Solana
 Arbitrum
 BNB Smart Chain
 Base
Base Polygon
 TRON
TRON Sui
Sui Robinhood


Deep Dive into Ethereum debug_trace APIs

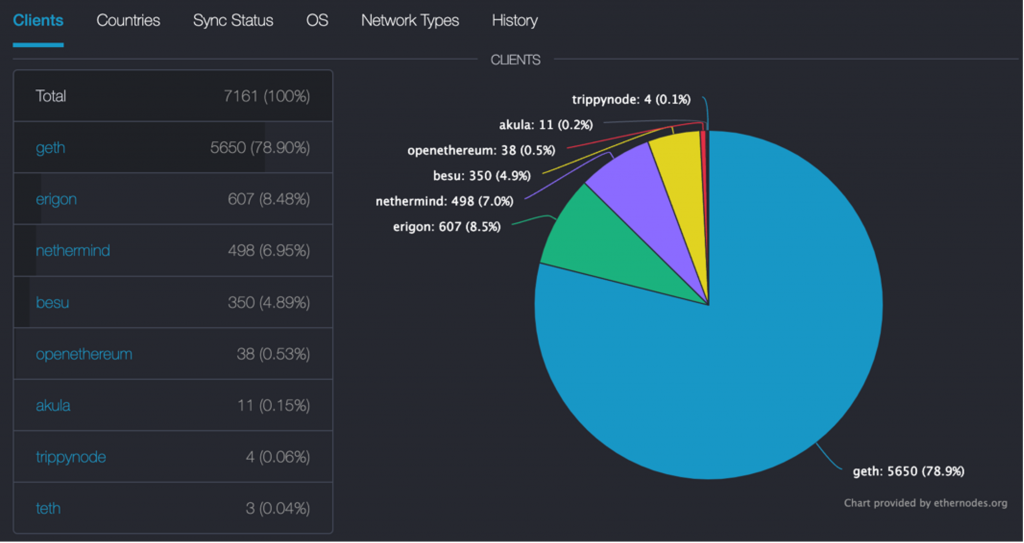
At the time of writing (Nov 2022), there are 7,000+ Ethereum nodes running in the world. 79% of them are Geth and about 21% are other types of clients.
Geth and Erigon are the two most popular Ethereum clients on the market. Both of them implement a special set of APIs for debugging transactions–the trace API.
This article explains what are debug_trace APIs and how to use them with code examples for each method.
There are some concepts you should know before deep diving into tracing:
- What is transaction
- What is state
- What is block
- What happens when you call a contract
If you are unsure about these terminologies, please check out this article about eth_call. It explains how transactions are executed by Ethereum, which is fundamental for tracing. If you have difficulty understanding the concepts and terms in this article, reading the eth_call article may help.
What is tracing?
A blockchain transaction may fail due to various reasons, for example:
- The sender account runs out of ether for gas
- There is a bug in one of the smart contracts.
- A user is blacklisted.
- The CPU use exceeds its limits during call execution
Tracing can help to identify the root cause of failure, on which step it fails, and the possible reason for that.
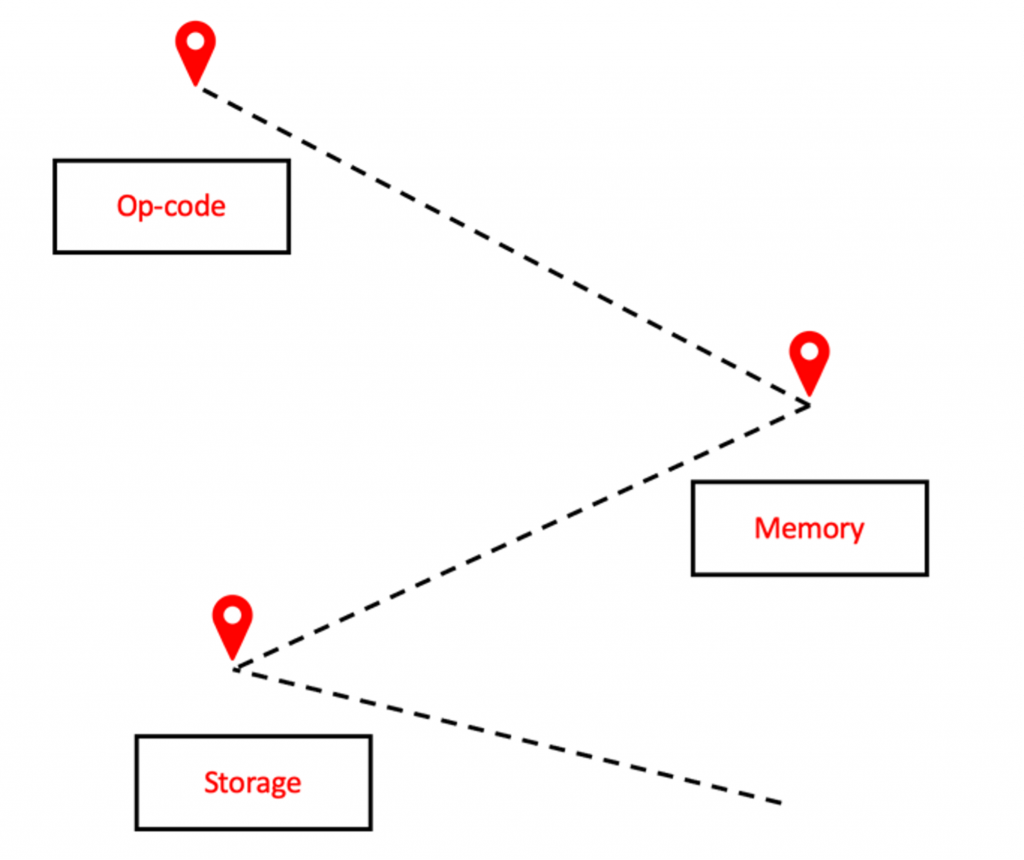
When an Ethereum client executes a transaction, the global state updates, for example:
- Account balance will change
- Some on-chain information may be modified
- New contract may be uploaded
Tracing collects the return data, state changes, and execution logs from transaction calls. It can be a contract call, a fund transfer, or a block execution.
What is a state?
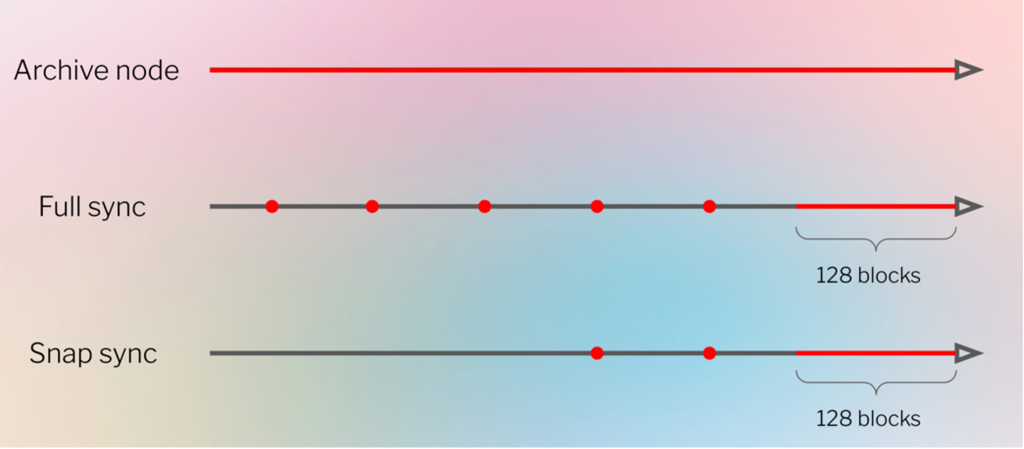
In order for a node to re-execute a transaction and to get the trace data, all the old state data accessed by the transaction must be available. This means transactions that can be traced are limited by the type of a node:
- An archive node retains all historical data back to genesis. It can therefore trace arbitrary transactions at any point in the history of the chain.
- A full node only retains the most recent 128 block states in memory. The older states are represented by a sequence of snapshots starting from genesis. The intermediate states can be regenerated from the snapshots, but it usually takes a long time to execute.
- A snap synced node is like a full node, but it only stores snapshots starting from its initial sync instead of genesis.
- A light node doesn’t store historical data, it only retrieves data on a need-to-use basis. Even though in theory, it can regenerate historical states through heavy computation; in practice, we can’t assume its data availability.
More details can be found in this article.
debug_trace using Geth & Erigon
For Geth, trace methods are in the debug_ namespace; for Erigon, trace methods are in both debug_ and trace_ namespaces. In this article, we will discuss both Geth and Erigon’s trace methods.
Common trace methods available in both Geth and Erigon:
- debug_traceCall
- debug_traceTransaction
- debug_traceBlockByNumber
- debug_traceBlockByHash
4 unique methods available on Geth:
- debug_traceBlock
- debug_traceBlockFromFile
- debug_traceBadBlock
- debug_traceChain
9 unique methods available on Erigon:
- debug_traceCallMany
- trace_call
- trace_callMany
- trace_replayBlockTransactions
- trace_replayTransaction
- trace_block
- trace_filter
- trace_get
- trace_transaction
Try it with Chainstack
All of the code samples mentioned further are developed and tested with a Chainstack endpoint—it is highly recommended to use one for the following reasons:
- 3 million free requests
- Supports both Erigon and Geth
- Seamless node deployment
Simply follow these steps to deploy a node:
You can check your node type on the project page. The default option is Geth.
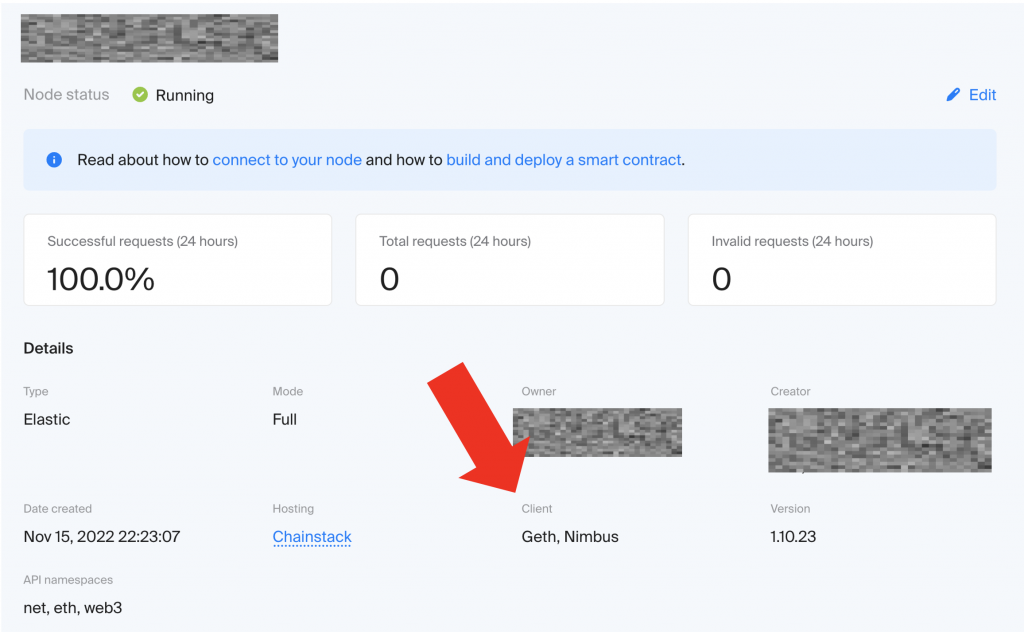
Erigon is only available on an archive node starting from the Business plan. To deploy an Erigon node, simply turn on the debug and trace APIs option when you deploy a node.

Deep dive into tracing methods
debug_trace methods available on both Geth and Erigon
debug_traceCall
This method executes an eth_call with tracing enabled.
{"method": "debug_traceCall", "params": [callObject, blockNumberOrHash, traceOption]}The first two parameters are exactly the same as eth_call. This is a basic fund transfer example of traceCall:
curl -H "Content-Type: application/json" -X POST --data '{"jsonrpc":"2.0","method":"debug_traceCall","params":[{"from":"0x1111111111111111111111111111111111111111","to":"0x2222222222222222222222222222222222222222","gas":"0x493E0","gasPrice":"0x37E11D600","value":"0xF"},"latest"],"id":1}' https:// nd-123-456-789.p2pify.com/ABCDabcdThis returns an empty log since there is no actual operation involved.
This is a basic write contract trace call example:
curl -H "Content-Type: application/json" -X POST --data '{"jsonrpc":"2.0","method":"debug_traceCall","params":[{"from":"0xe7e8569267c4a3278be75a2d86fd1a9e0a6818d8","to":"0xc2edad668740f1aa35e4d8f227fb8e17dca888cd","gas":"0x1E9EF","gasPrice":"0x2C2F7FD5E","data":"0x441a3e70000000000000000000000000000000000000000000000000000000000000010300000000000000000000000000000000000000000000000000c6c3eca729cb9e"},"latest"],"id":1}' https:// nd-123-456-789.p2pify.com/ABCDabcdTracing method in debug module supports various trace options, which gives huge flexibility on what types of data to collect:
- disableStorage: BOOL. Setting this to true will disable storage capture (default = false).
- disableStack: BOOL. Setting this to true will disable stack capture (default = false).
- enableMemory: BOOL. Setting this to true will enable memory capture (default = false).
- enableReturnData: BOOL. Setting this to true will enable return data capture (default = false).
- tracer: STRING. Name for built-in tracer or Javascript expression. See below for more details. If set, the previous four arguments will be ignored. If set, the previous four arguments will be ignored.
- timeout: STRING. Overrides the default timeout of 5 seconds for JavaScript-based tracing calls.
Sample code:
curl -H "Content-Type: application/json" -X POST --data '{"jsonrpc":"2.0","method":"debug_traceCall","params":[{"from":"0xe7e8569267c4a3278be75a2d86fd1a9e0a6818d8","to":"0xc2edad668740f1aa35e4d8f227fb8e17dca888cd","gas":"0x1E9EF","gasPrice":"0x2C2F7FD5E","data":"0x441a3e70000000000000000000000000000000000000000000000000000000000000010300000000000000000000000000000000000000000000000000c6c3eca729cb9e"},"latest",{"disableStorage": true, "disableStack":true,"enableMemory": false,"enableReturnData":false}],"id":1}' https:// nd-123-456-789.p2pify.com/ABCDabcdPlease take note that Erigon has a slightly different setup.
| Geth | Erigon |
| enableMemory: false | disableMemory:true |
| enableReturnData:false | disableReturnData:true |
You can either override a block data or state data by specifying “blockoverrides” (number, timestamp) or “stateOverride”(balance, nonce). Note the difference in the capital letter “O”, that is not a typo. It may be fixed in future development.
Below is a state override example for a fund transfer transaction:
curl -H "Content-Type: application/json" -X POST --data '{"jsonrpc":"2.0","method":"debug_traceCall","params":[{"from":"0x1111111111111111111111111111111111111111","to":"0x2222222222222222222222222222222222222222","gas":"0x493E0","gasPrice":"0x37E11D600","value":"0xFFFFFFFFFFFF"},"latest",{"stateOverrides":{"0x1111111111111111111111111111111111111111":{"balance":"0xFFFFFFFFFFFFFF"}}}],"id":1}' ' https:// nd-123-456-789.p2pify.com/ABCDabcddebug_traceTransaction
Just like how debug_traceCall traces a call, this method reruns a specific transaction identified with the transaction hash. Tracing a single transaction also requires re-executing all preceding transactions in the same block. Therefore, the historical state must be available.
Sample call:
curl -H "Content-Type: application/json" -X POST --data '{"jsonrpc":"2.0","method":"debug_traceTransaction","params":["0x09d2acb16d30e2017813b532392d0749e871c6ac3b8759424b2923c953928172"],"id":1}' https:// nd-123-456-789.p2pify.com/ABCDabcdSame as debug_traceCall, this method supports trace options and overriding.
debug_traceBlockByNumber
When you trace a block, you are basically tracing all transactions from a block in sequence. You can either specify it with the block number or a tag like “latest”.
Sample code:
curl -H "Content-Type: application/json" -X POST --data '{"jsonrpc":"2.0","method":"debug_traceBlockByNumber","params":["latest"],"id":1}' https:// nd-123-456-789.p2pify.com/ABCDabcdState overrides and block overrides are supported too:
curl -H "Content-Type: application/json" -X POST --data '{"jsonrpc":"2.0","method":"debug_traceBlockByNumber","params":["latest",{"stateOverrides":{"0x1111111111111111111111111111111111111111":{"balance":"0xFFFFFFFFFFFFFF"}},"blockoverrides":{"number":"0x50"},"disableStorage": true, "disableStack":true,"disableMemory": true,"disableReturnData":true}],"id":1}' https:// nd-123-456-789.p2pify.com/ABCDabcddebug_traceBlockByHash
This method is like debug_traceBlockByNumber but uses a block’s hash instead of block number.
Sample code:
curl -H "Content-Type: application/json" -X POST --data '{"jsonrpc":"2.0","method":"debug_traceBlockByHash","params":["0x77419be3c23ba236fb940d13f15a2ae26d1ec45e6bdb8c11822cde8bc75a6e94"],"id":1}' https:// nd-123-456-789.p2pify.com/ABCDabcdGeth unique debug_trace methods
debug_traceBlock
The traceBlock method will return a full stack trace of all invoked opcodes of all transactions that were included in a block. The transactions are executed in sequence.
To use traceBlock, two conditions must be fulfilled:
- The parent state of the block must be presented
- The RLP of the block is needed
An RLP is a serialized data of a block. It can be obtained by using debug_getBlockRlp method.
To use debug_traceBlock with the latest block, firstly you can use eth_getBlockByNumber to obtain the block number.
{"jsonrpc":"2.0","method":"eth_getBlockByNumber","params":["latest", false],"id":1}Please take note that the block number obtained here is in hexadecimal format and you need to convert it to an integer for the next step:
{"jsonrpc":"2.0","method":"debug_getBlockRlp","params":[123456],"id":1}A sample RLP would be:

Paste the RLP data into debug_traceBlock and run it. Just as other trace methods, it supports various trace options.
{"method": "debug_traceBlock", "params": [TheBlockRLP, traceOption]}debug_traceBlockFromFile
Similar to debug_traceBlock, traceBlockFromFile accepts a file that exists on the node and contains the RLP data of a block.
Sample code:
curl -H "Content-Type: application/json" -X POST --data '{"jsonrpc":"2.0","method":"debug_traceBlockFromFile","params":["blockRLP.txt",{}],"id":1}' https:// nd-123-456-789.p2pify.com/ABCDabcddebug_traceBadBlock
When Geth fails to execute a block, it puts the “bad block” into a pool for investigation. This method returns the trace logs for the bad block.
The blockhash needs to be sent with the request. To get a list of bad blocks, use: debug_getBadBlocks
Sample code:
curl -H "Content-Type: application/json" -X POST --data '{"jsonrpc":"2.0","method":"debug_ traceBadBlock ","params":[blockHash,{}],"id":1}' https:// nd-123-456-789.p2pify.com/ABCDabcddebug_traceChain
A chain is multiple consecutive blocks. This method will re-execute every block in a chain and return the trace information.
This method returns the structured logs created during the execution of EVM between two blocks (excluding start) as a JSON object. This endpoint must be invoked via
debug_subscribeas follows:debug_traceChain exampleconst res = provider.send('debug_subscribe', ['traceChain', '0x3f3a2a', '0x3f3a2b'])
A sample use case with wscat:

Erigon unique debug_trace methods
Erigon’s trace API is equivalent to openEthereum’s trace module. It doesn’t support trace options and state overrides, instead, it supports 3 different trace modes.
- trace: Transaction trace. An equivalent trace to that in the previous section.
- vmTrace: Virtual Machine execution trace. Provides a full trace of the VM’s state throughout the execution of the transaction, including for any sub-calls.
- stateDiff: State difference. Provides information detailing all altered portions of the Ethereum state made due to the execution of the transaction.
The data return from trace module APIs is in general cleaner and better structured. Hence easier to interpret.
The trace mode traces the operation results of all internal transactions for a call. The gas usage, input data, and the result of execution.
Sample code:
curl -H "Content-Type: application/json" -X POST --data '{"jsonrpc":"2.0","method":"trace_call","params":[{"from":"0xe7e8569267c4a3278be75a2d86fd1a9e0a6818d8","to":"0xc2edad668740f1aa35e4d8f227fb8e17dca888cd","gas":"0x1E9EF","gasPrice":"0x2C2F7FD5E","data":"0x441a3e70000000000000000000000000000000000000000000000000000000000000010300000000000000000000000000000000000000000000000000c6c3eca729cb9e"},["trace"],"0xF52578"],"id":1}' https:// nd-123-456-789.p2pify.com/ABCDabcdSample output:

The vmTrace mode traces the state of the virtual machine during transaction.
Sample code:
curl -H "Content-Type: application/json" -X POST --data '{"jsonrpc":"2.0","method":"trace_call","params":[{"from":"0xe7e8569267c4a3278be75a2d86fd1a9e0a6818d8","to":"0xc2edad668740f1aa35e4d8f227fb8e17dca888cd","gas":"0x1E9EF","gasPrice":"0x2C2F7FD5E","data":"0x441a3e70000000000000000000000000000000000000000000000000000000000000010300000000000000000000000000000000000000000000000000c6c3eca729cb9e"},["vmTrace"],"0xF52578"],"id":1}' https:// nd-123-456-789.p2pify.com/ABCDabcdSample output:

The stateDiff mode traces the state difference between each internal transaction. For example, changes in accounts’ balance, its storage data, etc.
Sample code:
curl -H "Content-Type: application/json" -X POST --data '{"jsonrpc":"2.0","method":"trace_call","params":[{"from":"0xe7e8569267c4a3278be75a2d86fd1a9e0a6818d8","to":"0xc2edad668740f1aa35e4d8f227fb8e17dca888cd","gas":"0x1E9EF","gasPrice":"0x2C2F7FD5E","data":"0x441a3e70000000000000000000000000000000000000000000000000000000000000010300000000000000000000000000000000000000000000000000c6c3eca729cb9e"},["stateDiff"],"0xF52578"],"id":1}' https:// nd-123-456-789.p2pify.com/ABCDabcdSample output:

trace_call
This is a mirror method of debug_traceCall.
Sample code:
curl -H "Content-Type: application/json" -X POST --data '{"jsonrpc":"2.0","method":"trace_call","params":[{"from":"0xe7e8569267c4a3278be75a2d86fd1a9e0a6818d8","to":"0xc2edad668740f1aa35e4d8f227fb8e17dca888cd","gas":"0x1E9EF","gasPrice":"0x2C2F7FD5E","data":"0x441a3e70000000000000000000000000000000000000000000000000000000000000010300000000000000000000000000000000000000000000000000c6c3eca729cb9e"},["trace"],"0xF52578"],"id":1}' https:// nd-123-456-789.p2pify.com/ABCDabcdtrace_callMany
This is a handy method that doesn’t exist on Geth. This method allows a user to send multiple transactions in a batch to oversee the executions. These transactions are executed in sequence, every transaction depends on the resulting state of previous transactions. The parameters:
The parameter structure:

Sample code:
curl -H "Content-Type: application/json" -X POST --data '{"jsonrpc":"2.0","method":"trace_callMany","params":[[[{"from":"0x1111111111111111111111111111111111111111","to":"0x2222222222222222222222222222222222222222","gas":"0x493E0","gasPrice":"0x37E11D600","value":"0xF"},["stateDiff"]],[{"from":"0x1111111111111111111111111111111111111111","to":"0x2222222222222222222222222222222222222222","gas":"0x493E0","gasPrice":"0x37E11D600","value":"0xF"},["stateDiff"]],[{"from":"0x1111111111111111111111111111111111111111","to":"0x2222222222222222222222222222222222222222","gas":"0x493E0","gasPrice":"0x37E11D600","value":"0xF"},["stateDiff"]]],"latest"],"id":1}' https:// nd-123-456-789.p2pify.com/ABCDabcdtrace_replayBlockTransactions
This is a mirror method of debug_traceBlockByNumber.
Sample code:
curl -H "Content-Type: application/json" -X POST --data '{"jsonrpc":"2.0","method":"trace_replayBlockTransactions","params":["0x2ed119",["stateDiff"]],"id":1}' https:// nd-123-456-789.p2pify.com/ABCDabcdtrace_replayTransaction
This is a mirror method of debug_traceTransaction.
Sample code:
curl -H "Content-Type: application/json" -X POST --data '{"jsonrpc":"2.0","method":"trace_replayTransaction","params":["0x09d2acb16d30e2017813b532392d0749e871c6ac3b8759424b2923c953928172",["stateDiff"]],"id":1}' https:// nd-123-456-789.p2pify.com/ABCDabcdtrace_block
Instead of re-executing a block like debug_traceBlockByNumber and trace_replayBlockTransactions, this method returns the actual trace data collected during block execution.
Sample code:
curl -H "Content-Type: application/json" -X POST --data '{"jsonrpc":"2.0","method":"trace_block","params":["0x2ed119"],"id":1}' https:// nd-123-456-789.p2pify.com/ABCDabcdtrace_transaction
Instead of re-executing a transaction like debug_traceTransaction and trace_replayTransaction, this method returns the actual trace data for transaction execution.
Sample code:
curl -H "Content-Type: application/json" -X POST --data '{"jsonrpc":"2.0","method":"trace_transaction","params":["0x09d2acb16d30e2017813b532392d0749e871c6ac3b8759424b2923c953928172"],"id":1}' https:// nd-123-456-789.p2pify.com/ABCDabcdtrace_filter
This method returns the traces that match the given filter.
Object– The filter objectfromBlock:QuantityorTag– (optional) From this block.toBlock:QuantityorTag– (optional) To this block.fromAddress:Array– (optional) Sent from these addresses.toAddress:Address– (optional) Sent to these addresses.after:Quantity– (optional) The offset trace numbercount:Quantity– (optional) Integer number of traces to display in a batch.
Sample code:
curl -H "Content-Type: application/json" -X POST --data '{"jsonrpc":"2.0","method":"trace_filter","params":[{"fromBlock": "0x2ed0c4","toBlock": "0x2ed128","toAddress": ["0x8bbB73BCB5d553B5A556358d27625323Fd781D37"]}],"id":1}' https:// nd-123-456-789.p2pify.com/ABCDabcdtrace_get
This call returns the specific trace of a transaction.
Hash– Transaction hash.Array– Index positions of the traces.
Sample code:
curl -H "Content-Type: application/json" -X POST --data '{"jsonrpc":"2.0","method":"trace_get","params":["0x17104ac9d3312d8c136b7f44d4b8b47852618065ebfa534bd2d3b5ef218ca1f3",["0x0",]],"id":1}' https:// nd-123-456-789.p2pify.com/ABCDabcddebug_traceCallMany
This is a mirror method of trace_callMany exposed in a debug module.
Sample code:
curl -H "Content-Type: application/json" -X POST --data '{"jsonrpc":"2.0","method":"debug_traceCallMany","params":[[[{"from":"0x1111111111111111111111111111111111111111","to":"0x2222222222222222222222222222222222222222","gas":"0x493E0","gasPrice":"0x37E11D600","value":"0xF"},["stateDiff"]],[{"from":"0x1111111111111111111111111111111111111111","to":"0x2222222222222222222222222222222222222222","gas":"0x493E0","gasPrice":"0x37E11D600","value":"0xF"},["stateDiff"]],[{"from":"0x1111111111111111111111111111111111111111","to":"0x2222222222222222222222222222222222222222","gas":"0x493E0","gasPrice":"0x37E11D600","value":"0xF"},["stateDiff"]]],"latest"],"id":1}' https:// nd-123-456-789.p2pify.com/ABCDabcdConclusion
This is the end of this tutorial. I hope you will find it useful. Thanks for reading.
If you have any questions, feel free to ping me on Twitter/Telegram/Discord.
Happy coding.
Cheers