Ethereum
 Solana
 BNB Smart Chain
 TON
TON Arbitrum
 Base
Base Avalanche
 Ronin
Ronin Optimism
 TRON
TRON Polygon
 Sonic
Sonic Aptos
Aptos Fantom
 Gnosis Chain


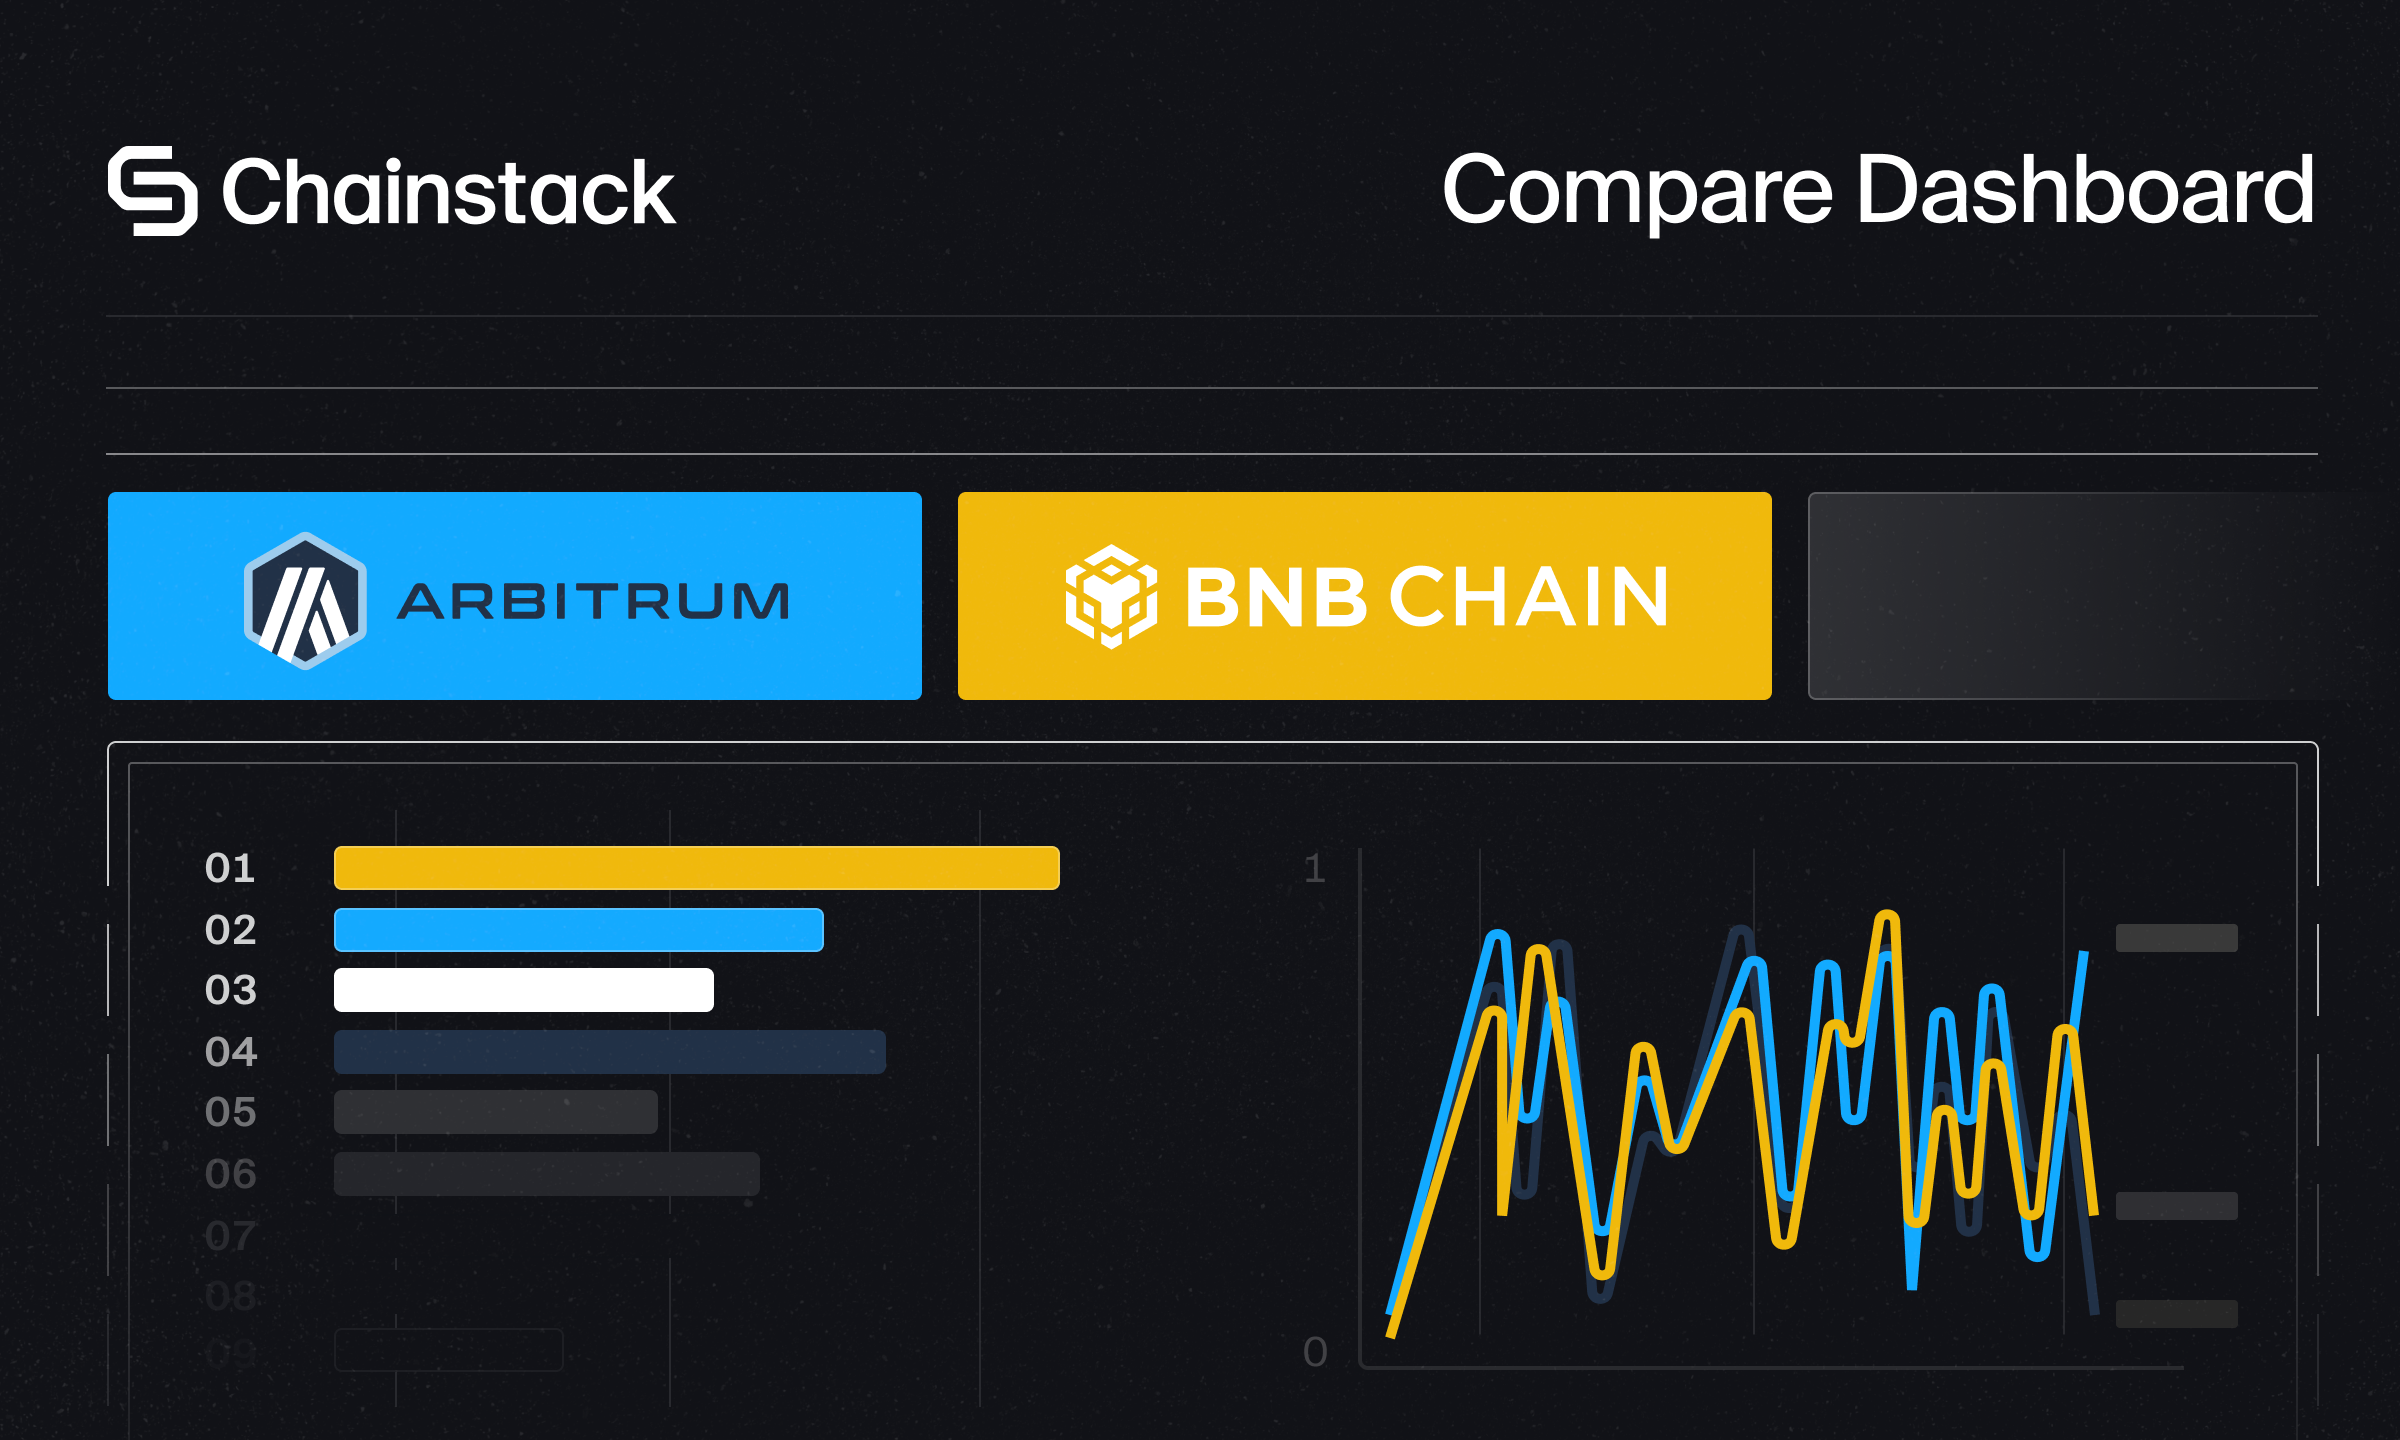
Compare Dashboard now tracks Arbitrum and BNB Smart Chain
At Chainstack, we are committed to providing Web3 developers and enterprises with full transparency into blockchain infrastructure performance.
Since the launch of the Chainstack Compare Dashboard, our goal has been to empower developers with real, actionable data—helping them make informed decisions about their infrastructure providers based on measurable reliability and performance.
Today, we are expanding the dashboard with the addition of two highly demanded networks:
With this update, Web3 developers building on Arbitrum or BNB can now access real-time infrastructure performance metrics—including API success rates, response times, and reliability—collected continuously from real network traffic.
Arbitrum RPC infrastructure benchmarking
Arbitrum has emerged as the leading Ethereum Layer 2 rollup, offering faster transactions and lower fees while inheriting Ethereum’s security guarantees.
However, like all blockchain networks, Arbitrum infrastructure varies significantly across providers—especially under high network load.
By integrating Arbitrum into the Chainstack Compare Dashboard, developers can now benchmark infrastructure performance in real time and evaluate key metrics that directly impact application stability and user experience.
BNB Smart Chain real-world RPC performance
BNB Smart Chain remains one of the highest-traffic blockchain networks globally, supporting a vast ecosystem of decentralized applications.
However, with scale comes complexity—and infrastructure performance on BNB varies considerably across providers and regions.

With this latest update, the Chainstack Compare Dashboard now tracks BNB, providing Web3 developers with full visibility into how providers handle production workloads—allowing for data-driven infrastructure decisions.
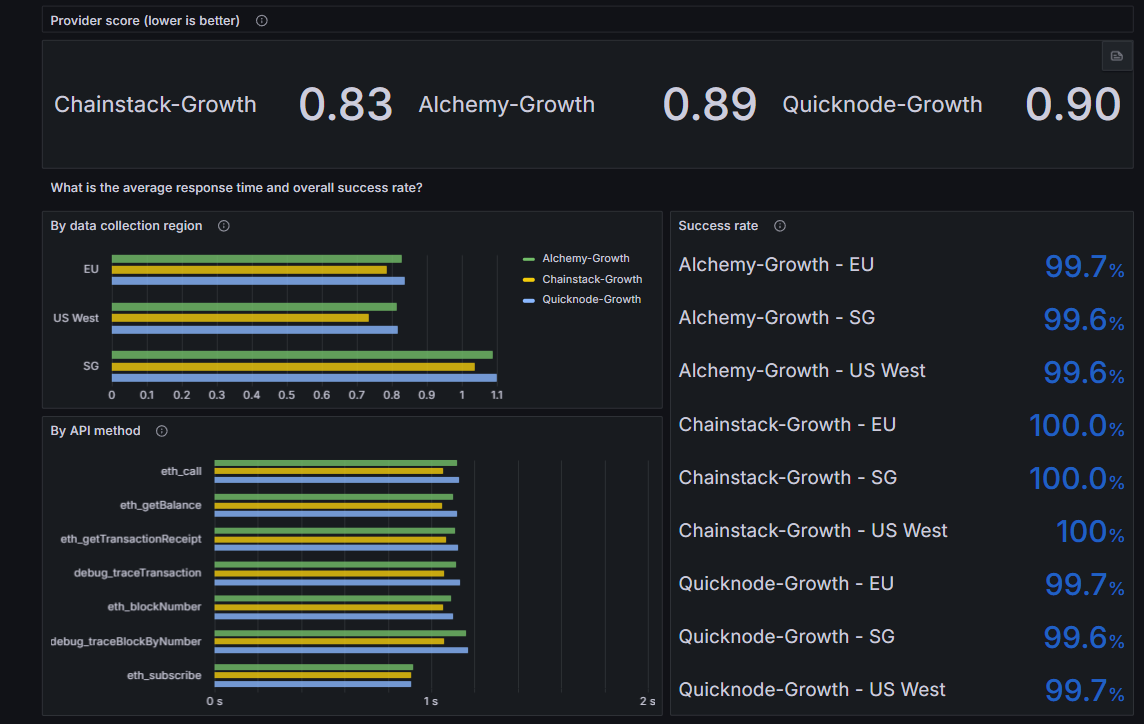
A data-driven approach to provider selection
The Chainstack Compare Dashboard is purpose-built to bring transparency to Web3 infrastructure. It operates through a distributed, multi-region architecture that:
- Continuously queries blockchain networks using real API calls.
- Collects and aggregates performance metrics across providers.
- Visualizes success rates, response times, and reliability in real time.
This enables developers to move beyond theoretical benchmarks and evaluate infrastructure based on real-world conditions.
To learn more about how the dashboard operates, read our original announcement or explore the open-source repository powering the system.
Benchmark your ARB and BNB RPC in real time
Arbitrum and BNB Smart Chain are now fully integrated into the Chainstack Compare Dashboard, joining existing support for Ethereum, Solana, Base, and TON.
We encourage all developers and enterprises building on Web3 to explore the Dashboard, validate their infrastructure choices, and ensure they are building on a foundation that meets the highest standards of reliability.
Power-boost your project on Chainstack
- Discover how you can save thousands in infra costs every month with our unbeatable pricing on the most complete Web3 development platform.
- Input your workload and see how affordable Chainstack is compared to other RPC providers.
- Connect to Ethereum, Solana, BNB Smart Chain, Polygon, Arbitrum, Base, Optimism, Avalanche, TON, Ronin, zkSync Era, Starknet, Scroll, Aptos, Fantom, Cronos, Gnosis Chain, Klaytn, Moonbeam, Celo, Aurora, Oasis Sapphire, Polygon zkEVM, Bitcoin and Harmony mainnet or testnets through an interface designed to help you get the job done.
- To learn more about Chainstack, visit our Developer Portal or join our Discord server and Telegram group.
- Are you in need of testnet tokens? Request some from our faucets. Multi-chain faucet, Sepolia faucet, Holesky faucet, BNB faucet, zkSync faucet, Scroll faucet.
Have you already explored what you can achieve with Chainstack? Get started for free today.