Ethereum
 Hyperliquid
 Solana
 Arbitrum
 BNB Smart Chain
 Base
Base Polygon
 TRON
TRON Sui
Sui Robinhood


How to buidl your own Web3 dashboard
This article will guide you through building a cool Web3-based dashboard on your own using a bit of Python and a Google spreadsheet. The idea is to help you get started on this journey of data exploration by showing you how to collect, process and present data in the simplest way possible. We will be fetching the data from Ethereum, a public blockchain platform, and we will see if we could make a dashboard out of it.
Dashing through data
The secret sauce of any thriving establishment is data. From deciding what to do next to gauging the impact of those decisions, all these steps require access to data.
In this age of information, large amounts of data are not that hard to find. But having access to enormous data does not guarantee its usability. For the data to be useful, you need to make sense of it and that can be a bit of a challenge. Even in the case of Web3, which tends to democratize the flow and storage of data, making sense of all the information which is scattered throughout the various chains and nodes can be a bit daunting, but that does not stop people from doing it. I mean, you must surely be familiar with the block explorers (like Etherscan). And if you are using a node provider like Chainstack, you must have come across the node request metrics dashboard. The purpose of all these platforms is to present data in a way that is easy to grasp. With the help of diagrams, charts, graphs, etc, we can craft and narrate powerful stories out of the huge amount of data and that is a neat trick to learn. To build such a platform on your own, you would need to write a ton of code, learn a lot of analytics and, create charts… you know the works, or you can use a bit of code, and some familiar tools and get the job done. So, here is one of the easiest ways to buidl your own Web3 dashboard.
Planning the exploration
As mentioned previously, our endeavour consists of three stages:
- Collecting data
- Processing data
- Presenting data
Let us see how we are planning to go through each of these steps.
Collecting data
All right, the first order of business in building a dashboard would be to collect the data. As we have already established, we will be fetching data from the Ethereum blockchain. We will use Python along with the web3.py library to collect the details of all the newly generated blocks in Ethereum. Once we have the blocks, we will retrieve certain details from them and store the data in our Google sheets for further processing.
Processing data
Once we store the data in our Google sheets, we can make use of all the in-built Google spreadsheet functionalities to process the data and build interactive charts and graphs out of that data.
Presenting data
After we prepare the charts, the next step would be to “embed” those charts onto a website or any other platform of your choice. We will also see how we make the charts update automatically upon receiving new data
Now that we have a plan, let us go ahead and set up a few prerequisites.
Prerequisites
Before we start building the dashboard, we need a few things.
To start things off, make sure that you have the following installed on your system
- Python (version ^3.6, preferably)
- The corresponding version of the python package manager (pip v21.3.1)
- A good code editor (I recommend VSCode)
Now that we have Python, we need to install a couple of Python packages.
Let’s start with web3.py. We will use this library to access the Ethereum blockchain via an Ethereum node. To install web3.py, open a terminal and type,
$ pip install web3 Now, the web3 library cannot access the Ethereum data unless we connect to an Ethereum node, so here’s how you can set up an Ethereum node.
- Heading over to Chainstack and setting up an account.
- Once you have your account, deploy a node in Chainstack.
Note: Here, we will be fetching data from the main Ethereum chain, so go ahead and set up an Ethereum mainnet node.
Now that you have the node,
- get the RPC endpoints (WSS) of the node
By using the WSS endpoint, we will be able to connect to our Ethereum node.
Apart from the web3 library, we also need to install a python package called gspread. This is a Python Application Program Interface (API) for Google sheets. To install gspread, use the following command,
$ pip install gspread Before we can access the spreadsheet using gspread, we need to enable the google sheets API service and create the necessary credentials to authorize and authenticate our application.
Here is how you can do it
- Head over to the Google Developers Console > sign in using your Google account > create a new project
- Click on ‘enable APIs and services

- Search and select google drive API > enable the API
- Do the same for Google Sheets API

We have enabled the necessary API services, now let’s generate the credentials
- In the project, go to credentials > click on Create Credentials > Select service account

Note: Service accounts help applications to access data via the Google APIs
- Fill in all the required details > click Done
- go to credentials once again > go to the service accounts section > select Edit service accounts
- Select keys > click Add key > click Create a new key
- Select JSON and click Create

This will automatically generate and download a JSON file carrying all the necessary credentials. The JSON file includes fields like account type, private_key, project_id,client_email, etc. Take care not to expose these details or share this file.
{
  "type": "service_account",
  "project_id": "PROJECT_ID",
  "private_key_id": "KEY_ID",
  "private_key": "-----BEGIN PRIVATE KEY-----\\nPRIVATE_KEY\\n-----END PRIVATE KEY-----\\n",
  "client_email": "SERVICE_ACCOUNT_EMAIL",
  "client_id": "CLIENT_ID",
  "auth_uri": "<https://accounts.google.com/o/oauth2/auth>",
  "token_uri": "<https://accounts.google.com/o/oauth2/token>",
  "auth_provider_x509_cert_url": "<https://www.googleapis.com/oauth2/v1/certs>",
  "client_x509_cert_url": "<https://www.googleapis.com/robot/v1/metadata/x509/SERVICE_ACCOUNT_EMAIL>"
}
To enable access to a particular google sheet,
- Sign into your Google account
- Create a new Google spreadsheet > give it a name
- Click on Share
- In the add people or group column, copy-paste the client_email from the JSON file
- Click Share
Once we share a Google spreadsheet with the client_email, we can use the gspread package and the JSON file to access it.
Great, now that we have set up a place to store the data, let us work on fetching the data.
A script to fetch data
Alright, we are about to write a Python script that will
- Connect to our Ethereum node
- Fetch the latest blocks
- Retrieve the required data
- Add the data to our Google sheets
So, open your code editor and create a new python file, script.py
To keep the script clean and readable, I am going to break the code into a set of functions, each with a specific task. These functions will:
- Handle the requests
- Fetch the latest block information
- Retrieve details from the blocks
- Add the details to the google sheets
So, let us start by importing some necessary libraries:
#for handling some asynchronous code
import asyncio

#for establishing connection with our node
import websockets
# for handling json data
import json

#for interacting with Ethereum node
from web3 import Web3

# for interacting with google sheets
import gspread
We also need to set a few values
#Setting the wss endpoint
CHAINSTACK_WSS_ENDPOINT = "wss://<chainstack_node_wss_enpoint"
#Location of credential.json file
GOOGLE_CREDENTIAL_LOCATION = "<credentials_json_location>"
#Name of the spreadsheet
GOOGLE_SPREADSHEET_NAME = "<google_sheet_name>"

#Access drive using our credential
DRIVE = gspread.service_account(filename=GOOGLE_CREDENTIAL_LOCATION)
#Access the first sheet in from the google spread sheet
SHEET = DRIVE.open(GOOGLE_SPREADSHEET_NAME).sheet1
Here, we used the WSS endpoint because we will try and “subscribe” to all the latest blocks created in the Ethereum blockchain. This means that we will be dealing with data streams and hence the WSS endpoint
Now that the values are set, let us write some functions.
The first set of functions would help us to manage something called filters. In Ethereum, filters notify us regarding certain events that take place in the Ethereum network. In our script, we will be dealing with the block filter, which will get us the details of all the new blocks that get generated in the network.
#Function to
# -> establish connection
# -> send the required rpc object
# -> receive and process the corresponding response
# Returns result
async def send_receive_data(_request_data):
    async with websockets.connect(CHAINSTACK_WSS_ENDPOINT) as websocket:
        await websocket.send(json.dumps(_request_data))
        resp = await websocket.recv()
        return json.loads(resp)["result"]

#Function to fetch the filter id
async def get_filter_id():
    #Prepping the request
    request_data = {
        "jsonrpc": "2.0",
        "method": "eth_newBlockFilter",
        "params": [],
        "id": 1
    }
    # send request to fetch the id
    filter_id = await send_receive_data(request_data)
    return filter_id
These functions will help us create a new filter using the “newBlockFilter” RPC method and fetch its id. Once we get the filter id, we can use the eth_getFilterChanges RPC method to poll for any changes in the filter (in our case, generation of new blocks) and fetch the details of those changes (the new block hash).
#function to
# -> establish connection with a node
# -> use the filter to fetch the hash details of new blocks
# -> get the details of the block using the block hash
async def get_block_details():
    #get the filter id
    filter_id = await get_filter_id()
    #prepare request using filter id
    request_data = {
    "jsonrpc": "2.0",
    "method": "eth_getFilterChanges",
    "params": [filter_id],
    "id": 0
    }
    #connect to  a chainstack node
    w3 = Web3(Web3.WebsocketProvider(CHAINSTACK_WSS_ENDPOINT))
		#keep polling for changes
    while True:
        new_block_hash = await send_receive_data(request_data)
        print(new_block_hash)
        #pass the hash value list to get_transaction_detail
        if(len(new_block_hash) != 0):
        #fetch the block details
           new_block =  w3.eth.get_block(new_block_hash[0])
           add_data_to_sheet(new_block)
Once we have the block details, we can create a function to retrieve certain details from the block.
#function to extract the details from the block
def extract_block_details(_new_block):
    #block size
    size = _new_block['size']
    #block number
    blockNumber = _new_block['number']
    #total gas used
    gasUsed = _new_block['gasUsed']
    #number of transactions in the block
    transactionNumber = len(_new_block['transactions'])
    #base fee / gas
    baseFeePerGas = _new_block['baseFeePerGas']
    #timestamp
    unixTimestamp = int(_new_block['timestamp'])
    #converting the unix timestamp to utc
    timestamp = datetime.utcfromtimestamp(unixTimestamp).strftime('%Y-%m-%d %H:%M')
    #returning the details in the form of a list
    return [size,blockNumber,gasUsed,transactionNumber,baseFeePerGas,timestamp]
Now let’s build a function to add the details to Google sheets.
def add_data_to_sheet(_new_block):
        blockInfo = extract_block_details(_new_block)
        try:
            SHEET.append_row(blockInfo)
        except Exception as e:
            #if we encounter "write quota exceeded" error
            if e.args[0]['code'] == 429:
                #pause the execution for a minute
                sleep(60)
                #retry with same data
                add_data_to_sheet(_new_block)
Since we are adding multiple fields to our Google sheets, it would be wise to add a set of headers to identify the fields. To set headers in our sheet, add the following lines of code right after the code for setting the required values.
#clear all data in the field
SHEET.clear()
        #headers for the sheet
HEADERS = [
				"Block size",
        "Block Number",
        "Total gas used",
        "Number of transactions",
        "Base fee / gas",
        "timestamp"
        ]
        #add the headers to the first line
SHEET.insert_row(HEADERS,index=1)
To link all these functions together, go to the get_block_details() function, remove the print statement at the end and add the following code:
add_data_to_sheet(new_block) Also, as an entry point for execution, we should add the following lines at the end of our script:
if __name__ == '__main__':
    loop = asyncio.get_event_loop()
    loop.run_until_complete(get_block_details())
    loop.close()
Alright, our completed script should look like this:
import asyncio #for handling some asynchronous code
import websockets #for establishing connection with our node
import json # for handling json data
from web3 import Web3 #for interacting with Ethereum node
import gspread # for interacting with google sheets

#setting the wss endpoint
CHAINSTACK_WSS_ENDPOINT = "wss://<chainstack_node_wss_enpoint"
#location of credential.json file
GOOGLE_CREDENTIAL_LOCATION = "<credentials_json_location>"
#name of the spreadsheet
GOOGLE_SPREADSHEET_NAME = "<google_sheet_name>"
#access drive using our credential
DRIVE = gspread.service_account(filename=GOOGLE_CREDENTIAL_LOCATION)
#access the first sheet in from the google spread sheet
SHEET = DRIVE.open(GOOGLE_SPREADSHEET_NAME).sheet1
#clear all data in the field
SHEET.clear()
        #headers for the sheet
HEADERS = [
				"Block size",
        "Block Number",
        "Total gas used",
        "Number of transactions",
        "Base fee / gas",
        "timestamp"
        ]
        #add the headers to the first line
SHEET.insert_row(HEADERS,index=1)

#function to
# -> establish connection
# -> send the required rpc object
# -> receive and process the corresponding the response
# returns result
async def send_receive_data(_request_data):
    async with websockets.connect(CHAINSTACK_WSS_ENDPOINT) as websocket:
        await websocket.send(json.dumps(_request_data))
        resp = await websocket.recv()
        return json.loads(resp)["result"]

#function to fetch the filter id
async def get_filter_id():
    #prepping the request
    request_data = {
        "jsonrpc": "2.0",
        "method": "eth_newBlockFilter",
        "params": [],
        "id": 1
    }
    # send request to fetch the id
    filter_id = await send_receive_data(request_data)
    return filter_id

#function to
# -> establish connection with a node
# -> use the filter to fetch the hash details of new blocks
# -> get the details of the block using the block hash
async def get_block_details():
    #get the filter id
    filter_id = await get_filter_id()
    #prepare request using filter id
    request_data = {
    "jsonrpc": "2.0",
    "method": "eth_getFilterChanges",
    "params": [filter_id],
    "id": 0
    }
    #connect to  a chainstack node
    w3 = Web3(Web3.WebsocketProvider(CHAINSTACK_WSS_ENDPOINT))
		#keep polling for changes
    while True:
        new_block_hash = await send_receive_data(request_data)
        print(new_block_hash)
        #pass the hash value list to get_transaction_detail
        if(len(new_block_hash) != 0):
        #fetch the block details
           new_block =  w3.eth.get_block(new_block_hash[0])
           add_data_to_sheet(new_block)

#function to extract the details from the block
def extract_block_details(_new_block):
    #block size
    size = _new_block['size']
    #block number
    blockNumber = _new_block['number']
    #total gas used
    gasUsed = _new_block['gasUsed']
    #number of transactions in the block
    transactionNumber = len(_new_block['transactions'])
    #base fee / gas
    baseFeePerGas = _new_block['baseFeePerGas']
    #timestamp
    unixTimestamp = int(_new_block['timestamp'])
    #converting the unix timestamp to utc
    timestamp = datetime.utcfromtimestamp(unixTimestamp).strftime('%Y-%m-%d %H:%M')
    #returning the details in the form of a list
    return [size,blockNumber,gasUsed,transactionNumber,baseFeePerGas,timestamp]

def add_data_to_sheet(_new_block):
        blockInfo = extract_block_details(_new_block)
        try:
            SHEET.append_row(blockInfo)
        except Exception as e:
            #if we encounter "write quota exceeded" error
            if e.args[0]['code'] == 429:
                #pause the execution for a minute
                sleep(60)
                #retry with same data
                add_data_to_sheet(_new_block)

if __name__ == '__main__':
    loop = asyncio.get_event_loop()
    loop.run_until_complete(get_block_details())
    loop.close()
Note: Here’s the code repository for reference : EVM-Dashboard. The code in the repository has been modularised for ease of navigation.
Now, all you need to do is to run the script, for that, open a terminal in the location of the script and type
$ python script.py This will fetch the block, retrieve the block details, and add the details to our google sheets. If you open your google sheets, you can see the data getting added to it.
A bit of Google sheet magic
Now that we have the data in our spreadsheet, let’s try and create some charts and diagrams out of it.
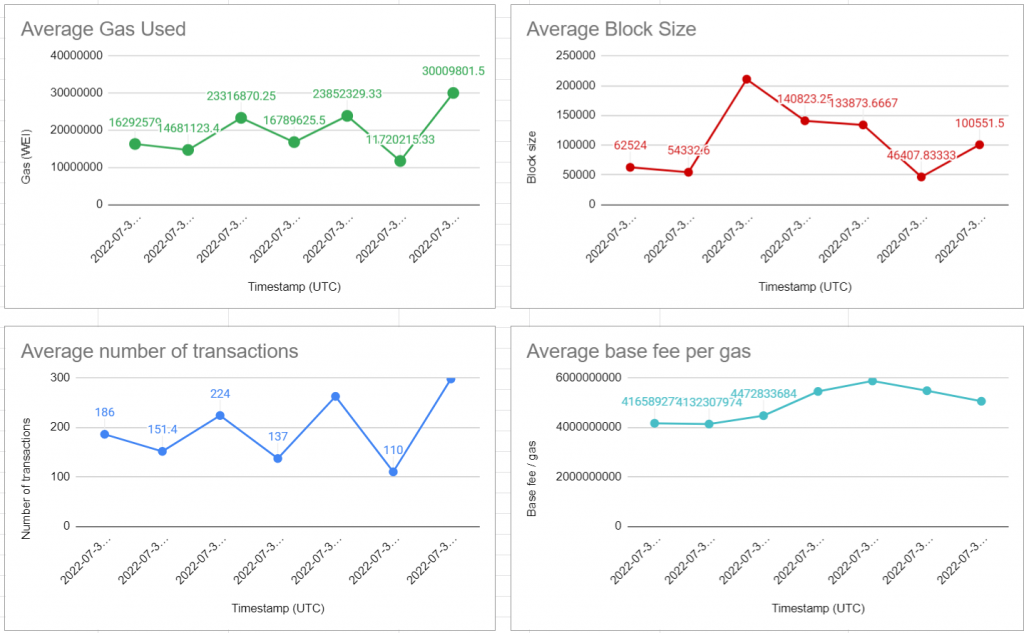
Google sheets have some prebuilt features that we can leverage to build powerful charts. Since we have multiple columns of data, we can use each of these columns as a basis for our charts and hence create multiple charts out of our data.
To create a chart out of a column, all you need do is select the column, click on the insert option from the top menu and click on charts. This will generate a line chart out of our data by default.

The line chart shows the variation in block size. Once you have such a chart you can modify every aspect of it, including the size of the chart, its style, name and even its theme.

We can even add data to the horizontal axis of the chart and start trying to create inferences out of our data. In our case, we can add the timestamp as the value of our horizontal axis, and this will give us an idea regarding the block size during different time periods. To do that, all you have to do is to add the column details to the x-axis field. Since the timestamp data starts from column F (in our case), we can give it as the value for the x-axis field.

Once we add the data to the horizontal axis, we can identify points in the chart that give us information regarding the block size during a particular timestamp. Now, I know that the x-axis can seem a bit crowded, however, we can create a cleaner chart by aggregating the data. Aggregation is the process by which we can create high-level summaries of our data, by combining individual data points. Here, we can aggregate the data and see if we could generate the average block size during a particular period. Here is how you do it:

Now, the point in the chart shows the average block size during a particular time. You can further customize the chart and make it look even cooler.

Here, I have changed the color of the line, displayed the data labels, and added the x-axis title. You can do all these things by tinkering around with the edit chart option.
Now that we know how to handle charts, we can use the same steps to create the charts out of all our data columns:
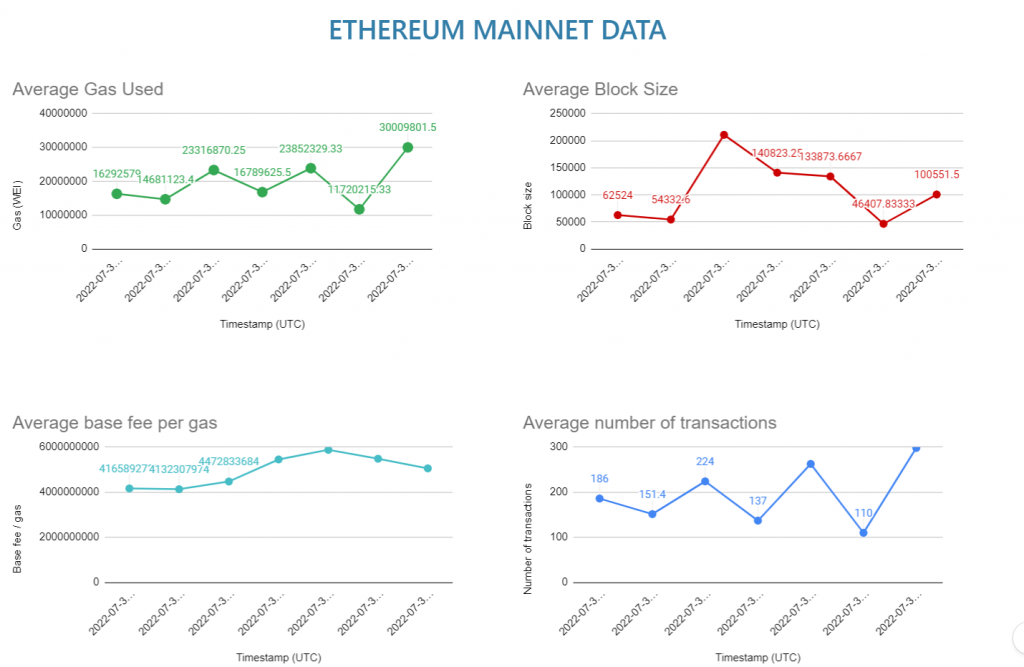
Embedding the charts
Alright, now that we have our charts, let’s look into ways to present them on a platform (websites and such) of our liking. To present the charts to other websites, first, we need to publish them:

Now, while publishing, make sure you have the “Automatically republish when changes are made” option enabled. As the name suggests, this option will update the charts automatically upon receiving new data and thus we will always be presenting the latest version of the charts. Now, once you publish, you can either use the link or the embed option to add the charts to a platform of your choice
Conclusion
The idea of this article was to show you how we can easily collect, process, and get insights out of web3-based data (or any other kind of data for that matter). The Google spreadsheet also allows the users to use more complex statistical formulas that can help derive more in-depth insights. We can connect our spreadsheet to tools like Google Data Studio, and generate more comprehensive reports of our data without the need for much code, but since we are trying to keep things simple, we will not be looking into those methods “for now.”
- Discover how you can save thousands in infra costs every month with our unbeatable pricing on the most complete Web3 development platform.
- Input your workload and see how affordable Chainstack is compared to other RPC providers.
- Connect to Ethereum, Solana, BNB Smart Chain, Polygon, Arbitrum, Base, Hyperliquid, Robinhood Chain, Tempo, MegaETH, Monad, Plasma, Avalanche, Optimism, Scroll, Aptos, Cronos, Gnosis Chain, Kaia, Moonbeam, Celo, Aurora, TON, Ronin, and Bitcoin mainnet or testnets through an interface designed to help you get the job done.
- Fast access to blockchain archive data and gRPC streaming on Solana.
- To learn more about Chainstack, visit our Developer Portal or join our Telegram group.
- Connect your AI agent to Chainstack in seconds using Chainstack MCP — give Claude, Cursor, Codex, Gemini, and Windsurf live access to blockchain data, node management, and docs.
- Are you in need of testnet tokens? Request some from our faucets. Sepolia faucet, Base Sepolia faucet, Solana devnet faucet, Hoodi faucet, BNB faucet, zkSync faucet, Scroll faucet, Hyperliquid faucet, Monad faucet, Amoy faucet, Plasma faucet, TON faucet.
Have you already explored what you can achieve with Chainstack? Get started for free today.