Ethereum
 Hyperliquid
 Solana
 Arbitrum
 BNB Smart Chain
 Base
Base Polygon
 TRON
TRON Sui
Sui MegaETH


Ethereum without L2: Charting the impact of rollups on network performance

Let’s take a moment to imagine a world where rollups never came to be. We’re just using the basic Ethereum layer, trying to handle our transactions and facing the resulting traffic. What would it really be like? That’s what our study aimed to explore.
In normal speak, the Ethereum network gets really busy. All this traffic slows things down and makes it more expensive for everyone. Rollups, which are a way of handling these transactions, helped plenty with this problem. We aimed to demonstrate just how important they are by showing what could happen without them.
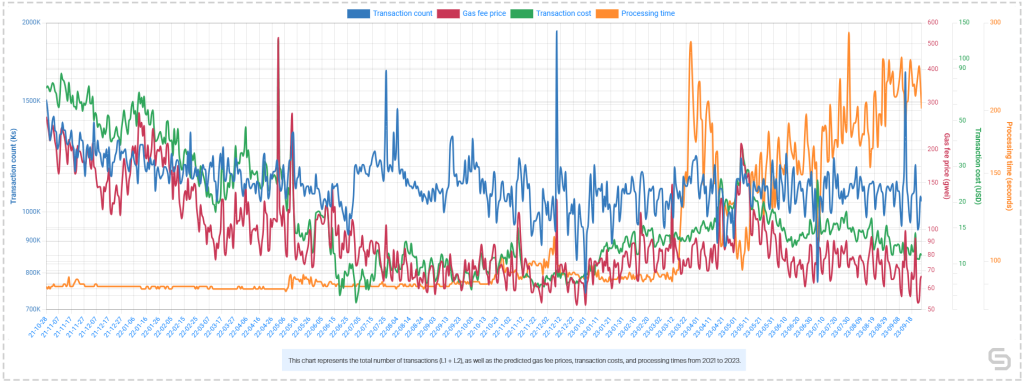
We came up with a way to show this using some numbers and a linear regression-type prediction model. This allowed us to observe the differences in the volume of transactions, the cost of gas, the difference in transaction costs, and the time it takes to process a transaction. We examined these differences on the top 5 most significant dates for the years 2021, 2022, and 2023.
We utilized this same model to study the effects of the absence of several rollup protocols. These protocols are different ways to handle transactions on the Ethereum network. They include Arbitrum, Optimism, Base, zkSync Era, Starknet, Linea, Polygon zkEVM, and the Boba Network.
The aim of this article is to help you understand how significant these rollups are for the Ethereum network. We’ll walk you through our findings in a way that’s easy to understand, even if you’re not a technical expert. Ready to uncover the importance of rollups in managing Ethereum network traffic? Let’s explore further:
Digging through Ethereum data
To understand Ethereum and what rollups do for it, we needed to gather a lot of data. We pulled this information from two main sources, Dune Analytics and Etherscan.
Transaction counts: First, we used Dune Analytics to determine how many transactions were happening each day. To do this we crafted a custom SQL query to extract the data on the total number of Ethereum, L2 rollup, and all transactions that happened in a day.
Transaction counts vs. volume: Next, using the same Dune Analytics approach and another custom SQL, we checked the volume of transactions for each day and compared it with the average gas price. This data informed us about how busy the Ethereum network got and how that affected gas prices.
ETH and gas prices: Once again, we used a custom SQL query on Dune Analytics to find out the daily ETH and gas prices. We extracted the average, lowest, and highest price for gas and how much gas was used each day. We also took note of the cost of gas in US dollars.
Block count: After Dune Analytics, we went to Etherscan to find out the number of blocks created each day on Ethereum. Each of these blocks was identified with a specific date, a Unix timestamp (which told us exactly when it was made), and a value that told us more about each block.
Block times: Finally, we used Etherscan again to find out how long it takes to create each block. Like the block count, this data also had a date, Unix timestamp, and a value attached to it to tell us more about it.
By collecting this information, we were able to construct a picture of how the Ethereum network operated and how rollups affected this operation.
Breaking down the calculations
The numbers we used in our calculations to determine how much rollups helped in decreasing congestion and speeding up transactions were derived from specific formulas. Together, they are part of the linear regression model that we used to predict the impact of L2 rollups, by applying the model to calculate the estimates.
There were five main formulae that we used in the prediction model—gas prices, transaction costs, congestion factor, base delay, and transaction processing times.
Gas price predictions
Predicting future gas prices was a key step in our analysis. This involved a close look at the average increase in gas price per transaction, which we label as avgG, alongside historical gas prices, H, and the count of transactions, T. Our method combined these factors to forecast gas prices accurately.
To predict gas prices, we started with the number of transactions and multiplied this by the average increase in gas price. We then added the historical gas price to this figure. To make this number more manageable, we divided the entire sum by 1 billion (1e9) to display it in gwei. This method provided us with a reliable estimate of future gas prices.
avgG= average gas price increase per transaction (single number)H= historical gas prices (array of numbers)T= transaction counts (array of numbers)
Utilizing the average gas price increase per transaction (avgG), historical gas prices (H), and transaction counts (T), our prediction formula was structured as:
predictedGasPrices[i] = (T[i] * avgG + H[i] / 1e9) (rounded to the nearest whole number) for i = 0 to n-1 where n is the number of elements in T.
This approach helped us in anticipating the potential future state of the Ethereum network, considering the activity on L2 rollup protocols. By understanding the factors influencing gas prices, we recognized the crucial role of these developments in improving network efficiency and capacity.
Transaction cost predictions
Projecting transaction costs in dollars was an essential final step, tying together our prior calculations and predictions. This process hinged on the predicted gas prices, known as P, coupled with the average gas used, denoted as U. Factoring in the daily Ether price, E, brought real-world context to our numbers, grounding them in the day-to-day market.
Our calculation began with the predicted gas price, which was then multiplied by the average amount of gas used. We simplified this number by dividing it by 1 billion (1e9), making the figures more tangible, as gwei units. The result was then adjusted according to the daily price of Ether. This comprehensive method yielded an anticipated average fee for gas usage, expressed in US dollars.
P= predicted gas prices (array of numbers)U= average gas used (array of numbers)E= daily ETH price (array of numbers)
By incorporating the predicted gas prices (P), average gas used (U), and daily ETH price (E), our formula for estimating transaction costs was:
predictedAvgGasFeeInUSD[i] = ((P[i] * U[i]) / 1e9) * E[i] for i = 0 to n-1 where n is the number of elements in P.
This calculation was crucial in forecasting the future state of the Ethereum network, particularly in the context of L2 rollups and their impact. Understanding potential transaction costs was key to recognizing the value of these advancements in enhancing network speed and efficiency.
Congestion factor calculations
The congestion factor was used to calculate the transaction processing times (base / predicted delay), according to block times. We looked at the count of transactions in each block per day, which we call B.
To find the congestion factor, we divided each day’s block count by the average block count for all days. This gave us an idea of how each day’s block count compares to the overall average, as we extrapolated it for the predictions.
B= block counts per day (array of numbers)avgB= average block count (single number)
To estimate the potential delay in transactions without the use of rollups, we used a formula that considers the number of rollup transactions and the average wait increase per block, alongside the base delay. By multiplying the average wait increase by the number of rollup transactions and adding that to the base delay, we were able to predict the potential delay in a hypothetical scenario without rollups.
Given the block counts (B) and the average block count per day (avgB), the formula was:
congestionFactor[i] = B[i] / avgB for i = 0 to n-1 where n is the number of elements in B.
These calculations aided us in simulating the future state of the Ethereum platform considering the impact of Layer 2 rollups. By understanding the potential delays without rollups, we could appreciate the importance of these scaling solutions in managing network congestion and improving overall network performance.
Base delay estimates
The base delay was a crucial metric used to determine the time required for transaction processing, factoring in the complexities of block times and the normative seven blocks needed to confirm a transaction.
Our approach involved analyzing the time taken to process each block, referred to as D, and the congestion factor previously computed. Additionally, we considered the total number of transactions, denoted as T, and the quantity of Layer 1 transactions, symbolized as L. This comprehensive analysis allowed us to calculate the base delay for each day with precision.
To derive the base delay, we initiated with the block time, amplified it by avgC, and then multiplied the result by the congestion factor. This value was further multiplied by the proportion of total transactions to L1 transactions. This intricate calculation offered us valuable insights into the daily fluctuations in transaction processing times.
D= block times in seconds (array of numbers)C= congestion factor (array of numbers)T= transaction counts (array of numbers)L= L1 transaction counts (array of numbers)avgC= average of 7 blocks to confirm a transaction
Employing the variables for block times (D), congestion factor (C), transaction counts (T), average blocks needed to confirm a transaction (avgC) ,and L1 transaction counts (L), the formula was articulated as:
baseDelay[i] = D[i] * avgC * C[i] * (T[i] / L[i]) for i = 0 to n-1 where n is the number of elements in D.
These calculations helped us envision what the Ethereum network might look like in the future, especially when we thought about L2 rollups that build on top of the basic network. Understanding how base delays work showed us how important these new technologies are for making the network faster and less crowded.
Transaction processing time predictions
Understanding the potential delays in transaction processing, especially without the use of rollups, was vital. For this, we introduced a specific formula that takes into account various factors.
This included the number of rollup transactions, denoted as R, and the average wait increase per block, termed avgW, as well as the base delay, B. Our method involved enhancing the average wait by the volume of rollup transactions and integrating this with the base delay.
This calculation provided us with a predictive look at possible delays, offering a glimpse into what might happen in scenarios without the benefit of rollups.
R= rollup transactions (array of numbers)avgW= average wait increase per block (single number)B= base delay (array of numbers)
By utilizing the rollup transactions (R), average wait increase per block (avgW), and base delay (B), our predictive formula was structured as:
predictedDelays[i] = (R[i] * avgW) + B[i] for i = 0 to n-1 where n is the number of elements in R.
Such predictions were essential in shaping our expectations for the future of the Ethereum network, particularly when considering the role of L2 rollups. Comprehending the potential for transaction delays underscored the significance of these innovative solutions in optimizing network throughput and reducing congestion.
Together, these calculations helped us estimate what would happen to the Ethereum network without the help of rollups. These were the crucial numbers we use to simulate the future state of the Ethereum platform considering Layer 2 solutions’ impact.
Evaluating the results
In this section, we’ll dive into the significant impact that Layer 2 rollups could have, based on our predictions. Our data and careful analyses helped us understand potential changes in things like transaction times and gas fees on the Ethereum network. Now, it’s time to discuss the most significant findings in both absolute and percentage terms and how they differed from 2021 to 2023.
The ascend of rollups in transaction counts
Starting in 2021, even a cursory look at the data showed the emergence of rollup transactions. Specifically, on November 15, the network recorded a high of 2,425 rollup transactions. While this might seem modest, it made up approximately 0.188% of all transactions on that very busy day.
In addition to that, November 22 and November 21 bore witness to 1,668 and 1,592 rollup transactions, comprising approximately 0.14% and 0.13% of total transactions, respectively. These figures highlight the budding but promising presence of rollups in Ethereum’s ecosystem.

Progressing to 2022, there was a noticeable acceleration in the use of rollups. The network registered a record spike of 11,111 rollup transactions on December 7, which was a whopping five times more than the previous year’s peak. These rollups made up about 1.13% of the total transactions for the day.
Furthermore, December 4, December 5, and December 8 saw remarkable rollup transactions ranging from 6,565 to 8,260, representing approximately 0.85%, 0.79%, and 0.77% of total transactions, respectively, highlighting the evolving usage and necessity of rollups in the Ethereum network.

Once we entered 2023, the rollup transactions shot up, setting a new record. On July 30, there were an impressive 100,088 rollup transactions that accounted for approximately 9.27% of all transactions that day.
Moreover, significant figures emerged throughout the year. On March 26, the network saw 93,863 rollup transactions that comprised about 8.46% of total transactions. Likewise, September 10 and September 17 recorded 83,683 with a percentage cost increase peaking at an incredible 677.82%.

Scrutinizing these detailed accounts, it’s clear how rollup transactions have gone from representing a minor fraction of the network’s activity in 2021 to playing a vital part in Ethereum’s functioning by 2023. These growing figures illustrated their increasing acceptance and crucial function in driving overall network efficiency—a telling tale of the transition within Ethereum’s network operations.
Decoding predicted gas price differences
In 2021, the network registered notable spikes in predicted gas price differences. On October 28, the predicted gas difference reached 68 gwei, the highest observed for the year. Although it looks like a small figure, it played a considerable role in the total transaction process.
Other standout days included October 29, November 3, November 2, and November 10, exhibiting predicted gas differences ranging from 63 to 66 gwei. Most significantly, on December 26, the predicted gas percentage difference hit nearly 91.53%—marking the highest percentage difference for the year.

Fast-forward to 2022, the gas price predictions were even loftier. For instance, on December 9, the network recorded a predicted gas difference that skyrocketed to 87 gwei, a remarkable increase from the previous year.
Other prominent days like July 26, August 4, February 20, and May 12 also presented significant predicted gas differences, ranging from 60 to 76 gwei. However, the true stand-out moment came on September 17, when the predicted gas percentage difference posted a staggering 666.67%, showing the volatility and unpredictability of gas price predictions.

By the time 2023 rolled around, the predicted gas differences had reached new heights. Specifically, on September 13, the network registered a predicted gas difference of 75 gwei, an impressive figure even by growing standards.
Other significant dates emerged throughout 2023, such as March 30, June 10, March 28, and March 31, showing predicted gas differences from 55 to 56 gwei. Interestingly, September saw astounding swings in predicted gas price percentage differences, culminating on September 24 with an approximate difference of 440.00%.

Looking at the data from 2021 to 2023, it’s clear that the predicted gas price differences have seen a consistent uptrend. This growth trend illustrated the increasing complexity and dynamic nature of the Ethereum network and highlighted the impactful role of rollup transactions in mitigating network congestion and improving overall network performance.
Delving into transaction cost differences
During 2021, the Ethereum network saw considerable variations in transaction cost differences. On November 10, an absolute cost difference of approximately $21.17 was marked, while the cost percentage increase for the day was approximately 5.17%.
Other notable days, such as November 12, November 9, November 11, and November 8, recorded absolute transaction cost differences ranging from approximately $20.86 to $21.08. Additionally, the year saw significant cost percentage increases with the highest being approximately 92.88% on December 26.

In 2022, the transaction cost dynamics illustrated a notable escalation. On January 3, an absolute cost difference of approximately $17.28 was accounted for, representing a corresponding cost percentage increase of 51.17%.
Other significant days throughout the year like January 2, January 4, January 5, and January 1 displayed absolute transaction cost differences ranging from approximately $17.04 to $17.13. However, September 17 outshone other days with a cost percentage increase peaking at an eye-opening 677.82%.

As we reached 2023, the transaction cost differences had expanded further. Specifically, on April 16, Ethereum marked an absolute transaction cost difference of approximately $10.69. Besides this, other days also showed important changes.
These were April 17, April 15, April 14, and April 18. Transaction cost differences on these days were significant. They ranged from about $10.27 to $10.46. When it came to percentage terms, the most notable dates were September 22-24 with increases from 360.94% to 419.52%.

Examining these figures from 2021 to 2023, it became clear the transaction costs within the Ethereum network have become significantly more complex, displaying considerable differences over the years.
This underlined the growing importance of rollup transactions in managing transaction costs and improving the overall network performance, visibly paving the way for a progressive Ethereum network.
Analyzing transaction processing time
In 2021, Ethereum saw changes in how long it took to process transactions. One notable day was November 15. On this day, there was a longer wait time of 5 extra seconds. This meant a 5.17% increase in waiting times compared to usual.
Several other days stood out for similar reasons. November 21 and November 22 each had a 3-second delay. This was about a 3.40% and 3.56% increase, respectively. November 19 and November 20 also experienced more delays. On these days, the increase was 2 seconds. The percentage increase for November 19 was roughly 2.68%. For November 20, the exact increase isn’t known.

Moving onto 2022, the dynamics of transaction delays had considerably exacerbated. Specifically, on December 7, the absolute delay increase shot up to 21 seconds, which represented a percentage delay increase of about 23.14%.
Days like December 4, December 5, December 8, and October 27 also sported considerable absolute delay increases, reaching from 12 to 16 seconds, and corresponding percentage delay increases between approximately 13.70% and 17.24%.

Come 2023, the transaction delays had shot up even more dramatically. For instance, on July 30, a striking absolute delay increase of 189 seconds was registered—the highest for the year, resulting in a delay percentage increase of about 191.89%. But the trend was not isolated to this day.
Other significant days throughout the year like March 26, September 10, March 25, and August 26 saw remarkable absolute delay increases, ranging from 157 to 177 seconds, with corresponding delay percentage increases reaching between approximately 161.48% and 180.05%.

Reflecting on these numbers from 2021 to 2023, it’s evident that transaction processing times within Ethereum have gone from moderately variable to markedly dynamic. This evolution underscores the importance of technological advancements like rollup transactions in managing network congestion and improving the overall efficiency of the Ethereum network.
Examining the global average results
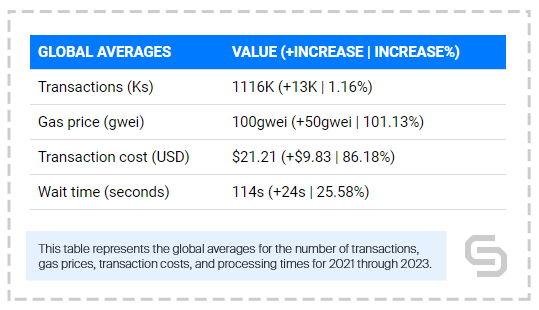
When evaluating the overall network performance based on global averages, several key insights come to light:
Total transactions: Globally, the total number of transactions averaged out to 1,116,000, with an average of 13,000 being rollup transactions. The global total transactions percent increase stood at around 1.16%.
It illustrated the network’s growth and a steady rise in the number of transactions being processed. Despite rollup transactions making up such a small proportion of total transactions, they played a vital role in improving transaction processing efficiency, as noted in the other results.
Average gas price: An increase of 50 gwei in the average gas price was noted, corresponding to an astonishing rise of about 101.13%. The doubling of gas prices underscores the significant impact L2 rollups have on the cost of each transaction. Overall, rollups have played an integral role in managing these costs through improved network efficiency and scalability.
Average transaction cost: The noticeable increase in transaction costs averaging $9.83 (86.18%) for an average predicted transaction cost of $21.21 displays the linkage between gas prices and transactional expenses.
As gas prices inflated due to growing demand, transaction costs invariably increased. And as they did for the average gas price, this is where L2 rollup transactions showed to offer a significant advantage.
Average processing time: The global predicted delay was roughly 114 seconds, and there has been an increase of about 24 seconds. This translated to a percent increase in predicted delay of approximately 25.58%. These figures highlighted the challenges in maintaining prompt transaction processing times in the face of increasing network demand.
Judging from these global averages, it’s evident that the Ethereum network is continuously evolving its capabilities, with rollup transactions playing an increasingly vital role in network efficiency and cost-effectiveness.
The impact of Layer 2 rollups on the Ethereum ecosystem
Our in-depth analysis from 2021 to 2023 revealed the transformative influence of Layer 2 rollups on the Ethereum network, evident in several critical areas:
Transaction counts
Our findings show a steady climb in the number of rollup transactions, growing from a nominal presence in 2021 to a formidable force by 2023. For instance, July 30, 2023, marked a milestone with a record 100,088 rollup transactions, comprising a substantial 9.27% of the total transactions that day. This surge underscored the escalating reliance on Layer 2 rollups to bolster network efficiency and scalability.
On a global scale, the total number of transactions averaged 1,116,000, with rollup transactions averaging 13,000. This consistent growth, with a 1.16% increase in total transactions, reflects the network’s expansion and the integral role of rollups in enhancing transaction throughput.
Predicted gas prices
While our gas price predictions indicated a rising trend, signifying a bustling Ethereum network, Layer 2 rollups emerged as a powerful counterbalance. A striking instance is December 9, 2022, when the predicted gas price difference reached 87 gwei, yet rollups contributed about 1.13% of total transactions, showcasing their efficacy in tempering gas price spikes.
The global average paints a similar picture, with an average increase of 50 gwei in gas prices — a remarkable 101.13% rise. This sharp increase highlighted the crucial role of Layer 2 rollups in managing transaction costs and sustaining network stability.
Predicted transaction costs
Between 2021 and 2023, we observed a persistent ascent in predicted transaction costs, a consequence of the network’s heightened activity. A notable peak occurred on April 16, 2023, with a transaction cost difference of roughly $10.69. Despite these challenges, Layer 2 rollups demonstrated their capacity to mitigate cost escalations, ensuring Ethereum remains an affordable platform.
The global average transaction cost experienced a significant leap to $21.21, an 86.18% increase, further emphasizing the critical buffer rollups provide against escalating operational costs.
Predicted processing times
Our analysis detected a considerable prolongation in transaction processing times, a testament to Ethereum’s burgeoning activity. However, Layer 2 rollups shone in their ability to manage these delays. A case in point is July 30, 2023, when the network saw an absolute delay increase of 189 seconds, but thanks to rollups, the delay percentage increase was around 191.89%.
Globally, the average predicted delay stood at approximately 114 seconds, with an increase of about 24 seconds or 25.58%. These statistics signified the mounting pressures on the network’s processing capabilities and the instrumental role of rollups in sustaining manageable transaction timelines.
In reflection, Layer 2 rollups were not just an incremental improvement but a paradigm shift for the Ethereum ecosystem. They enhanced transaction processing capacity, moderated gas and transaction expenses, and improved processing speeds, marking a pivotal phase in Ethereum’s journey.
As we look ahead, it’s clear that Layer 2 rollups were not just a temporary fix but a foundational layer for Ethereum’s enduring resilience and performance, essential to its future as a leading decentralized platform.
Curious to explore the data on your own? Play around with the interactive chart here.
Bringing it all together
Our data revealed a notable rise in transaction counts over the years with rollup transactions playing an increasingly prominent role. This trend underscored the impact of Layer 2 rollups in accommodating a larger volume of transactions thereby enhancing network efficiency and scalability in the face of growing demand.
Ethereum’s vitality also emerged in rising gas prices over time. However, Layer 2 rollups demonstrated their potential to effectively mitigate these cost surges, reinforcing stability in the Ethereum network.
As transaction cost predictions continued to rise, reflecting the increasing transactional activity, Layer 2 rollups helped to cap these increases, ensuring that Ethereum remains a cost-effective platform for users across the globe.
The marked increase in transaction processing times over the period also spoke to growing activity within the Ethereum ecosystem. Yet again, Layer 2 rollups rose to the occasion, managing these times more effectively and showcasing their crucial role in reducing network congestion and improving transaction efficiency.
In conclusion, our meticulous processing of historical data, diligent calculations, and careful interpretation of the results illuminated the transformative effect of Layer 2 rollups on the Ethereum ecosystem. By boosting transaction capacity, alleviating gas and transaction costs, and enhancing transaction processing times, these technological advancements promise to be invaluable to Ethereum’s evolution.
Our analysis pointed to a future where Layer 2 rollups would continue to reinforce Ethereum’s robust performance, further consolidating its stance as a robust decentralized platform well-equipped to meet growing demand.
Power-boost your project on Chainstack
- Discover how you can save thousands in infra costs every month with our unbeatable pricing on the most complete Web3 development platform.
- Input your workload and see how affordable Chainstack is compared to other RPC providers.
- Connect to Ethereum, Solana, BNB Smart Chain, Polygon, Arbitrum, Base, Hyperliquid, Tempo, MegaETH, Monad, Plasma, Avalanche, Optimism, Scroll, Aptos, Cronos, Gnosis Chain, Kaia, Moonbeam, Celo, Aurora, TON, Ronin, and Bitcoin mainnet or testnets through an interface designed to help you get the job done.
- Fast access to blockchain archive data and gRPC streaming on Solana.
- To learn more about Chainstack, visit our Developer Portal or join our Telegram group.
- Connect your AI agent to Chainstack in seconds using Chainstack MCP — give Claude, Cursor, Codex, Gemini, and Windsurf live access to blockchain data, node management, and docs.
- Are you in need of testnet tokens? Request some from our faucets. Sepolia faucet, Base Sepolia faucet, Solana devnet faucet, Hoodi faucet, BNB faucet, zkSync faucet, Scroll faucet, Hyperliquid faucet, Monad faucet, Amoy faucet, Plasma faucet, TON faucet.
Have you already explored what you can achieve with Chainstack? Get started for free today.