Ethereum
 Solana
 Hyperliquid
 Arbitrum
 Base
Base BNB Smart Chain
 Tempo
Tempo Avalanche
 Aptos
Aptos TRON
TRON Ronin
Ronin zkSync Era
 Optimism
 Sonic
Sonic Polygon
 Unichain
 Fantom
 Gnosis Chain
 Sui
Sui Avalanche Subnets
 Polygon CDK
 Starknet Appchains
 zkSync Hyperchains


6 free tools to pick the top RPC node provider
Every millisecond matters when your app is syncing blocks or querying smart contracts. RPC performance isn’t about the numbers on a pricing page, it’s about how those endpoints behave when your users need them most.
Rather than choosing providers based on feature lists and pricing, six testing tools let you measure actual performance: throughput during network spikes, latency across regions, and how endpoints handle the specific mix of calls your application makes to Ethereum, Solana, Base, and other chains.
Introduction
Choosing an RPC node provider used to be as simple as checking price and pressing Deploy. Today, Web3 teams juggle RPC endpoints for better reliability and latency, route multi-region traffic, work with debug & trace APIs, and a dozen other moving parts. The good news is that you no longer have to make that call blind: 6 free and low-cost tools can measure the metrics that really matter and surface the provider that fits your workloads.
“Which RPC provider is reliable enough for production?” and “Who is the top RPC node provider for Ethereum, Base, or Solana?”- these are perfectly reasonable questions, and price is only one piece of the equation.
1. Chainbench — open-source stress testing tool
Most RPC providers display an impressive “No rate limits” or “Up to 10,000 RPS” badges, but raw throughput means nothing if a single wallet read takes 15 seconds during a gas spike. Chainbench solves this gap by replaying your traffic pattern: native on-chain interaction, RPC API calls, and deep archive reads against multiple endpoints in parallel. You set concurrency, method mix, and duration; Chainbench exports full latency histograms plus fail-rate heat maps, so you see precisely where a node throttles under pressure.
Why it matters: Synthetic tests that mimic your production mix highlight headroom issues long before they hit Mainnet users. Run Chainbench for 15 minutes, and you will know whether a million Requests/Credits/Compute Units is really enough for your application.
2. Provider status pages and SLA trackers
Every serious RPC vendor now publishes a public uptime dashboard. Do not treat these pages as marketing fluff. Tools like BetterUptime and StatusPage.io expose historical incident data and mean-time-to-repair (MTTR). Check that pages and compare month-over-month performance. Patterns emerge quickly: some platforms recover from client crashes in minutes, while others require half a day.
Pro tip: You can place each candidate’s RSS feed into a Slack channel called #rpc-incidents. After two weeks, the channel tells its own story. If one provider floods your feed with “degraded performance” alerts, cross it off.
3. Explorer-assisted block lag monitors
Block explorers are more than UX candy. Create a free account at Chainstack or any other top RPC provider. By querying eth_getBlockNumber on EVM chains or getBlockHeight on Solana, then cross-checking the reported blockNumber height against the latest height on an explorer API, you can calculate block lag in real time. Wrap that logic in a simple cron script and you’ll know when an endpoint quietly falls 10 blocks behind the network. Of course, it depends on the chain and what app you are building: requirements for a trading bot, a wallet, or analytic dashboards are different.
Check the code example at Chainstack Docs
Tooling tip: Combine Etherscan (or equivalent) with Prometheus + Grafana to chart lag per region. The graph often reveals night-time maintenance windows that vendors never document.
4. OpenTelemetry collectors for end-to-end tracing
Latency on chain calls rarely lives in isolation. Analytics Dashboard or Wallet UX also depends on your load balancer, CDN, and back-end. Deploy an OpenTelemetry collector inside your stack and instrument every outbound JSON-RPC call. You will capture queue_time, connect_time, and server_processing_time. When a signature broadcast feels slow, trace IDs jump across spans and point to the sluggish hop: sometimes it is the provider, sometimes your own proxy.
Outcome: Armed with distributed traces, you negotiate SLA credits with data in hand instead of anecdotal “users say it is slow.”
5. RPC endpoint testing tool
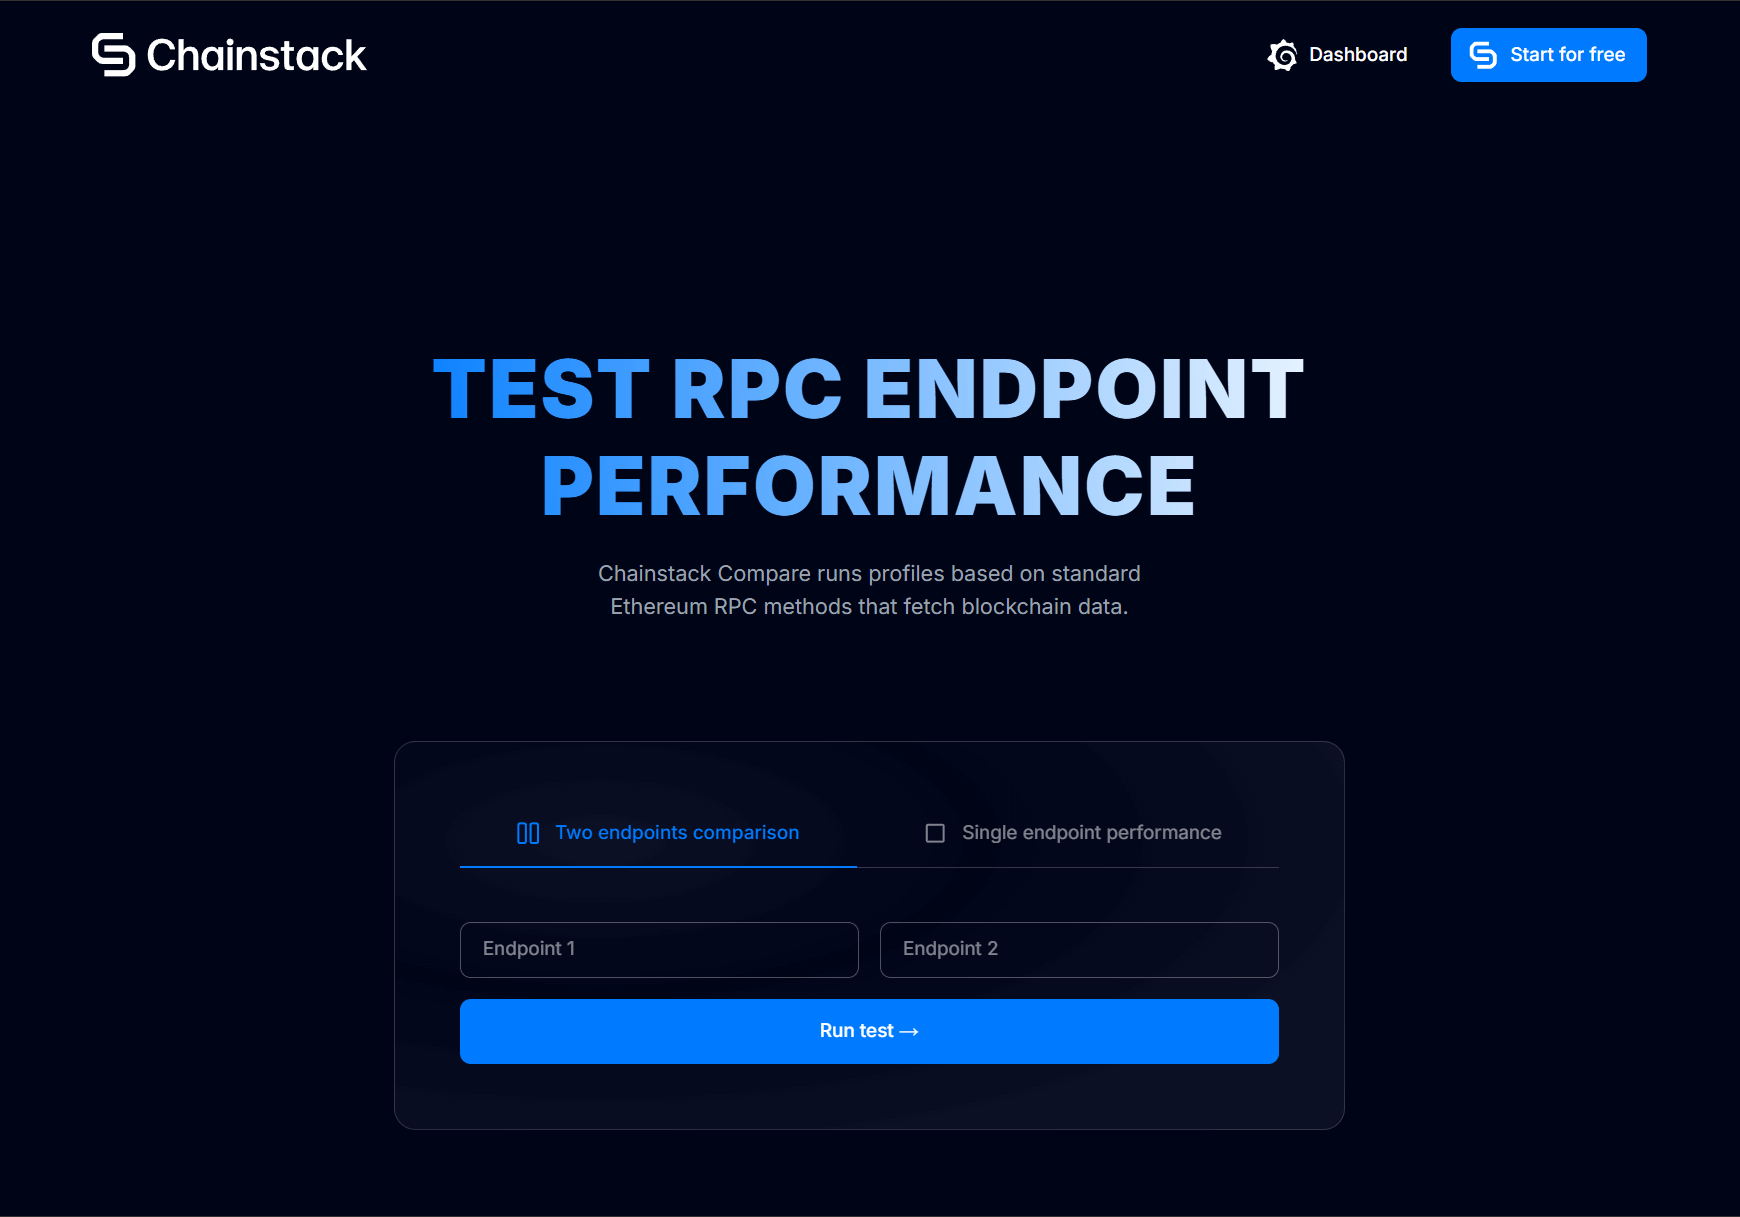
Use Chainstack Compare to benchmark how any two RPC endpoints stack up on real-world data-fetching workloads. A node that answers a single JSON-RPC call in 150 ms can still choke when you pull hundreds of blocks for an indexer or back-test. Chainstack Compare highlights the throughput ceiling, helping you choose endpoints (or plan horizontal scaling) before your production jobs fall behind the canonical chain height.
Chainstack Compare — endpoint testing tool
6. Node comparison dashboards
Community projects such as ethnode-stats aggregate p99 latency, failure rate, and regional round-trip delay for the top RPC providers: Chainstack, Alchemy, Infura, Ankr, QuickNode, and more. This dashboard continuously pings RPC endpoints from different locations. Use them for a neutral view of real-world experience, then validate results with your own Chainbench runs.
Endpoint Compare Dashboard by Chainstack
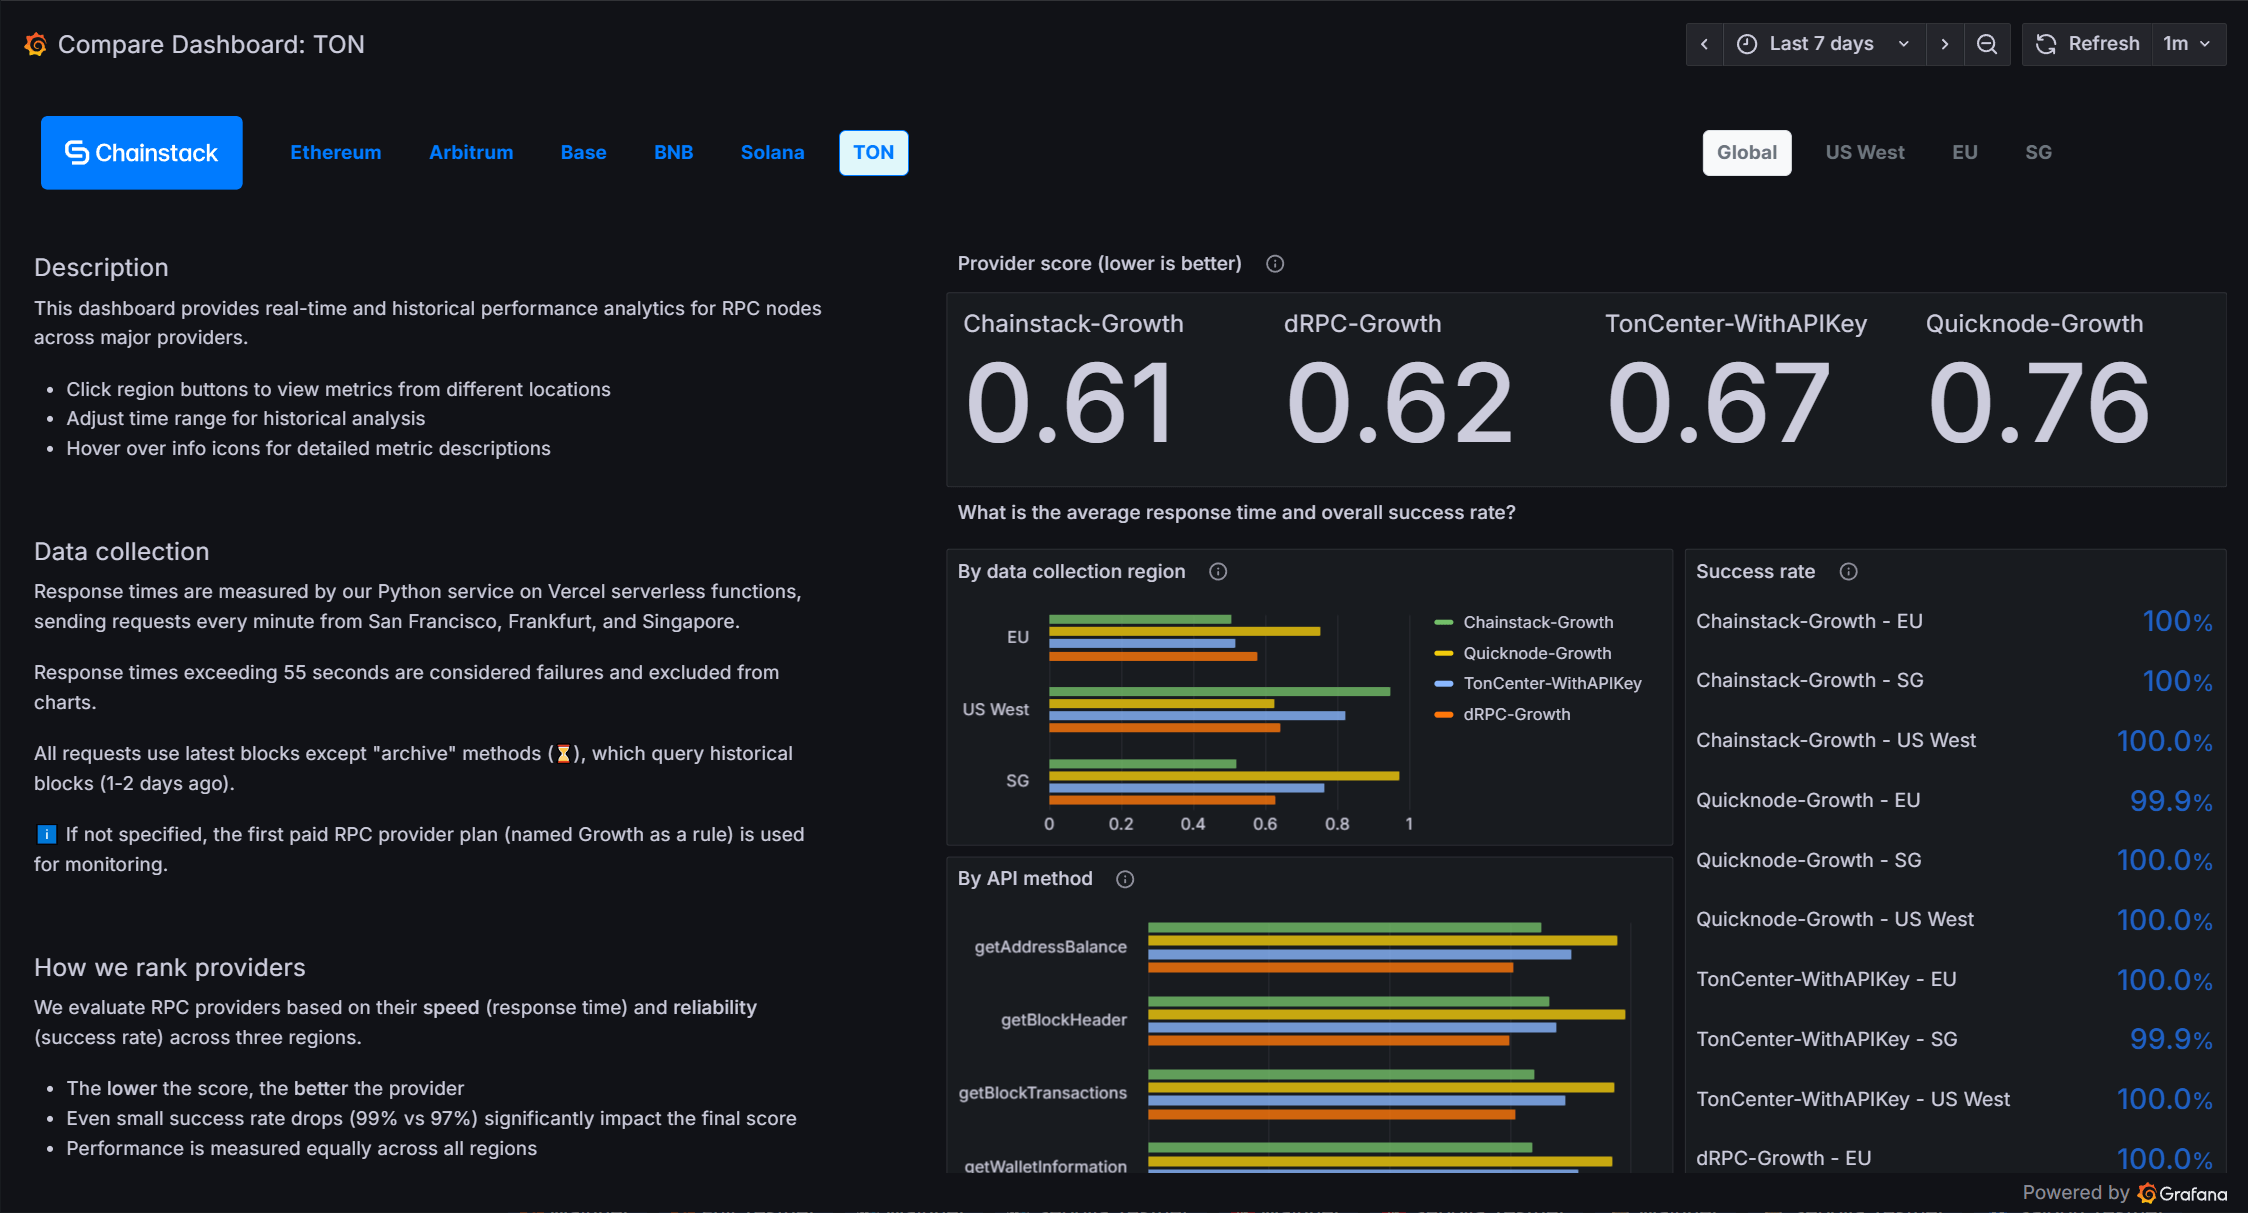
Watch for hidden value: Sometimes a provider ranks second on median latency but dominates on p99 tail, which is critical for trading bots and Web3 wallets, where the slowest call decides success.
Final thoughts
Developers once chose RPC nodes by googling “Best Ethereum RPC provider”. That era is gone. With enterprise-grade monitoring, open-source stress harnesses, and transparent pricing calculators, you can treat node selection like any other engineering decision: measure, compare, iterate.
Try one or two of the tools above today. By the time your next feature ships, you will know which RPC partner can handle the flood of Mainnet RPC calls without melting your budget or your users’ patience.
Further Reading
- How to secure your RPC endpoints with access rules: Step-by-step setup for filtering traffic by domain and IP address to block unauthorized access.
- Tips to handle RPC request errors: Learn how to catch, retry, and route around RPC request failures using native JavaScript patterns and ethers.js.
- 5 essential factors for setting up RPC node endpoints: Everything you need to know about rate limiting, caching, security, and disaster recovery for RPC nodes.
Power-boost your project on Chainstack
- Discover how you can save thousands in infra costs every month with our unbeatable pricing on the most complete Web3 development platform.
- Input your workload and see how affordable Chainstack is compared to other RPC providers.
- Connect to Ethereum, Solana, BNB Smart Chain, Polygon, Arbitrum, Base, Optimism, Avalanche, TON, Ronin, zkSync Era, Starknet, Scroll, Aptos, Fantom, Cronos, Gnosis Chain, Klaytn, Moonbeam, Celo, Aurora, Oasis Sapphire, Polygon zkEVM, Bitcoin and Harmony mainnet or testnets through an interface designed to help you get the job done.
- To learn more about Chainstack, visit our Developer Portal or join our Discord server and Telegram group.
- Are you in need of testnet tokens? Request some from our faucets. Multi-chain faucet, Sepolia faucet, Holesky faucet, BNB faucet, zkSync faucet, Scroll faucet.
Have you already explored what you can achieve with Chainstack? Get started for free today.