Ethereum
 Hyperliquid
 Solana
 Arbitrum
 BNB Smart Chain
 Base
Base Polygon
 TRON
TRON Sui
Sui Robinhood


Blockchain RPC for AI agents: infrastructure guide (2026)
Key takeaways
- AI agents generate a fundamentally different RPC load profile than dApps — burst requests, deep parallelism, and unpredictable timing that shared endpoints were never designed to absorb.
- Rate limits are the primary infrastructure bottleneck for agentic workflows. Understanding the difference between RPS, RPM, and Request Units is the first step to sizing your infrastructure correctly.
- Request batching, connection pooling, and fallback chains are the three architectural patterns that meaningfully reduce agent failure under load.
- Dedicated Nodes eliminate rate limit contention entirely. Global Nodes with geo-routing reduce the P99 latency spikes that break multi-step agent reasoning chains.
- Chainstack’s MCP server lets AI coding assistants deploy nodes, query live chain data, and search docs — without leaving the IDE or terminal.
- An infrastructure checklist for production agentic systems is at the end of this article.
Introduction: why your AI agent is not just another dApp user
When a human uses a DeFi application, they click a button, wait two seconds, read the result, and click again. The RPC node handling that request sees a trickle — maybe a few calls per minute, with natural pauses built in by human cognition.
Your AI agent does not pause to think.
A moderately complex DeFi agent — one that monitors liquidity pools, calculates optimal routes, checks token approvals, and executes a transaction — can generate 50 to 200 RPC calls in the time it takes a human to reach for their coffee. A multi-agent system coordinating three or four specialized sub-agents multiplies that by the number of parallel threads running simultaneously. Add a feedback loop where the agent re-queries state after each action, and you are looking at sustained request rates that would immediately trigger rate limiting on any shared public endpoint.
This is not a theoretical problem. It is the first infrastructure wall most teams building on-chain AI agents hit, usually at the worst possible moment: during a live demo, or when a real transaction is on the line.
This article covers what that wall actually looks like at the infrastructure level, the architectural patterns that let you work around it, and how to choose node infrastructure that matches how agents actually behave — rather than how dApp users do.
1. How AI agents use blockchain RPC — understanding the load profile
Before you can make the right infrastructure decision, you need to understand what your agent’s RPC traffic actually looks like. It is almost certainly not what traditional node provider capacity planning assumes.
Burst vs. steady-state traffic
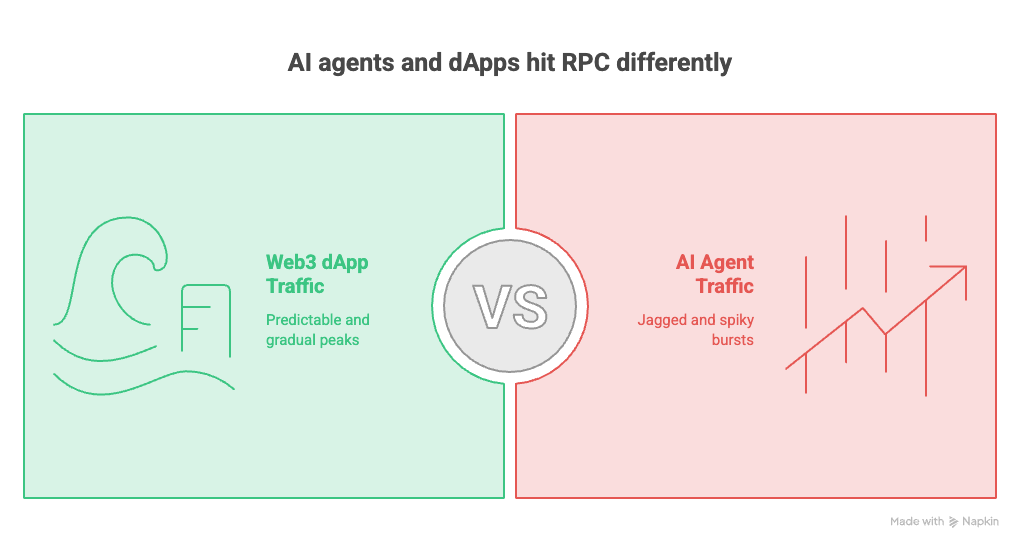
A typical web3 dApp generates relatively predictable traffic with gradual peaks. User sessions are bounded by human attention spans. Even a popular DEX sees traffic spikes that follow recognizable patterns — market opens, news events, gas price windows.
An AI agent’s traffic pattern looks nothing like this. Agents fire requests in bursts tied to their internal reasoning cycles, not to human behavior. A LangChain agent with tool calls to an Ethereum node will generate zero requests for several hundred milliseconds while the language model processes its context window, then fire five or ten requests in rapid succession as it executes a reasoning step. This creates a jagged, spiky load profile that is hostile to shared infrastructure designed around average throughput assumptions.
If your provider enforces a requests-per-second (RPS) limit, an agent that hits 10 RPS in a 200-millisecond burst can trigger a 429 even if its average rate over the last minute is well within limits.
Parallelism from multi-agent systems
Single-agent systems are manageable. Multi-agent systems — where a coordinator dispatches tasks to specialized sub-agents that run concurrently — multiply your RPC load by the number of active agents. If you have a portfolio monitoring agent, a trade execution agent, and a risk assessment agent all querying the same Ethereum node simultaneously, your effective request rate is the sum of all three, not the average.
Frameworks like LangGraph, CrewAI, and AutoGen make it straightforward to build multi-agent pipelines. They do not make it straightforward to reason about the aggregate RPC load those pipelines generate. You need to do that math yourself before your agents hit production.
Long-running workflows vs. one-shot transactions
A user submitting a transaction from a browser wallet completes in seconds. An agent managing a yield optimization strategy might run continuously for hours, re-querying prices, recalculating positions, and monitoring on-chain events in an ongoing loop.
Long-running workflows expose a failure mode that one-shot transactions never encounter: accumulated rate limit pressure. An agent that stays within RPS limits but generates 50,000 calls over the course of a day can hit daily or monthly request caps on shared plans, causing the endpoint to start refusing requests mid-workflow. Unlike a failed transaction, this failure is silent from the user’s perspective — the agent just stops making progress.
Concrete load patterns by agent type
| Agent type | Typical RPC methods | Load pattern |
|---|---|---|
| DeFi yield optimizer | eth_call, eth_getStorageAt, eth_getLogs | Continuous polling with burst on rebalance |
| On-chain data analyst | eth_getLogs, debug_traceBlock, eth_getBlockByNumber | Heavy archive reads, episodic bursts |
| Transaction execution agent | eth_sendRawTransaction, eth_getTransactionReceipt, eth_call | Low steady-state, high burst at execution |
| Price monitoring agent | eth_call against price oracles, WebSocket subscriptions | Sustained high-frequency polling |
| Multi-chain bridge agent | All of the above, multiplied across chains | Highest aggregate load |
2. Rate limits: what they actually mean for agents
Rate limiting is the most misunderstood aspect of RPC infrastructure for teams new to agentic systems. Most developers understand rate limits in theory. Far fewer understand the three distinct dimensions across which limits are enforced — or why each one matters differently for agents.
RPS, RPM, and Request Units — the three dimensions
Requests per second (RPS) is the instantaneous burst limit. Hit 100 requests in a single second on a plan that allows 25 RPS and you will receive 429 responses for the excess, regardless of how quiet you were in the previous minute. This is the limit that kills agents with tight reasoning loops.
Requests per minute (RPM) is the rolling window average. Some providers use this instead of, or in addition to, RPS limits. An agent that paces itself to avoid RPS limits can still hit RPM caps if its minute-over-minute average creeps up.
Request Units (RU) are Chainstack’s usage metric — and the most practical dimension for cost planning. The model is intentionally simple: a standard full-node call costs 1 RU; an archive node request or Debug & Trace API call costs 2 RUs. That’s it. No opaque compute unit tables with hundreds of method-specific costs. For an agent that heavily uses debug_traceTransaction or eth_getLogs against historical blocks, the 2 RU cost per call is the number to build your capacity model around.
Estimating your agent’s RU consumption: list every RPC method your agent calls. Full-node methods = 1 RU each. Archive or Debug & Trace methods = 2 RUs each. Multiply by expected calls per workflow run, then by runs per day. Add a 3x buffer for burst spikes and parallelism from multi-agent coordination.
Why public endpoints destroy agentic workflows
Public RPC endpoints from chain foundations are designed for developer testing, not production workloads. They enforce aggressive RPS limits (typically 1–5 RPS), do not offer WebSocket subscriptions at any useful reliability level, and apply no SLA guarantees.
An agent hitting a public endpoint in a burst will receive 429 responses immediately. If the agent is not built to handle 429s gracefully — and most aren’t on first implementation — it will either crash or enter a retry loop that eventually times out and loses whatever state it was maintaining.
Beyond rate limits, public endpoints impose another problem: no request isolation. Every other developer testing against the same endpoint competes with your agent for capacity. Traffic spikes from unrelated developers affect your agent’s latency, unpredictably and without warning.
What happens when you exceed rate limits
The immediate effect is a 429 Too Many Requests HTTP response. What happens next depends on how your agent handles it:
- No retry logic: the call fails, the exception propagates up the call stack, and the workflow terminates or enters an error state. Any in-progress state that wasn’t persisted is lost.
- Naive retry (immediate): the agent retries instantly, hits the limit again — creating a retry storm that makes the problem worse.
- Exponential backoff (correct approach): the agent waits 1 second, then 2, then 4, backing off until the rate limit window resets. Minimum viable implementation, but it introduces latency into time-sensitive workflows.
- State loss under sustained limits: if rate limiting persists longer than the agent’s internal timeout, even correct backoff fails. The workflow must restart from scratch — or worse, in an inconsistent on-chain state if a partial transaction sequence was in progress.
Chainstack’s error responses are standardized and designed to be machine-readable: they include helpful details and links to documentation so your agent knows exactly what happened and what to do next — whether it needs to upgrade a plan, reduce its request rate, or switch to a different endpoint.
3. RPC patterns for agentic workflows
Given the load profile described above, the following architectural patterns meaningfully reduce failure rates and latency for on-chain agents.
Request batching
JSON-RPC supports batch requests — multiple method calls sent in a single HTTP request, returning a single response array. Most agent frameworks do not use this by default.
[
  {"jsonrpc": "2.0", "method": "eth_getBalance", "params": ["0xABC...", "latest"], "id": 1},
  {"jsonrpc": "2.0", "method": "eth_getTransactionCount", "params": ["0xABC...", "latest"], "id": 2},
  {"jsonrpc": "2.0", "method": "eth_call", "params": [{"to": "0xDEF...", "data": "0x..."}, "latest"], "id": 3}
]
Sending three calls as one batch request consumes one RPS unit instead of three. For agents that need to read multiple state variables at each reasoning step, batching can reduce effective RPS consumption by 60–80%.
For on-chain read operations across multiple contracts, Multicall3 goes further — it aggregates arbitrary eth_call invocations into a single contract call, reducing both RPS consumption and latency for complex state reads.
Chainstack nodes support all standard simulation methods your agent needs for increased inference time and safer decision-making: eth_simulateV1 and eth_call for EVMs, simulateTransaction for Solana, and full forking with Foundry. An agent can simulate a transaction before executing it, giving it time to reconsider without committing gas.
Connection pooling and persistent connections
HTTP/1.1 connections have overhead at the TCP handshake level. An agent that opens a new connection for every RPC call adds 20–100ms per call in connection setup latency. This compounds badly in tight reasoning loops.
Use HTTP/2 where your provider supports it — it multiplexes multiple requests over a single connection. At minimum, configure your HTTP client to use keep-alive connections.
For Python-based agents using web3.py:
from web3 import Web3
from requests import Session
from requests.adapters import HTTPAdapter

session = Session()
adapter = HTTPAdapter(pool_connections=10, pool_maxsize=20, max_retries=3)
session.mount("https://", adapter)

w3 = Web3(Web3.HTTPProvider(YOUR_CHAINSTACK_ENDPOINT, session=session))
Retry logic with exponential backoff and jitter
Exponential backoff with jitter prevents the thundering herd problem where multiple agent threads all retry at exactly the same moment after a 429.
import random
import time

def rpc_call_with_backoff(func, max_retries=5):
    for attempt in range(max_retries):
        try:
            return func()
        except Exception as e:
            if "429" in str(e) and attempt < max_retries - 1:
                wait = (2 ** attempt) + random.uniform(0, 1)
                time.sleep(wait)
            else:
                raise
WebSocket subscriptions for event-driven agents
Agents that need to react to on-chain events have two options: poll with repeated eth_getLogs calls, or receive via push. Polling is RPS-expensive and introduces latency proportional to your polling interval.
WebSocket subscriptions via eth_subscribe give you real-time event delivery without polling overhead:
async def subscribe_to_events(ws_url, contract_address, event_topic):
    async with websockets.connect(ws_url) as ws:
        await ws.send(json.dumps({
            "jsonrpc": "2.0",
            "method": "eth_subscribe",
            "params": ["logs", {"address": contract_address, "topics": [event_topic]}],
            "id": 1
        }))
        async for message in ws:
            event = json.loads(message)
            await handle_event(event)
Fallback chains for resilience
A single RPC endpoint is a single point of failure. For production agents, implement a fallback chain:
ENDPOINTS = [
    "https://your-chainstack-dedicated-node.p2pify.com/...",
    "https://your-chainstack-global-node.p2pify.com/...",
]

def get_web3_with_fallback(endpoints):
    for endpoint in endpoints:
        try:
            w3 = Web3(Web3.HTTPProvider(endpoint))
            if w3.is_connected():
                return w3
        except Exception:
            continue
    raise RuntimeError("All RPC endpoints unavailable")
4. Infrastructure requirements for production agents
Dedicated vs. shared nodes
Shared node infrastructure means your agent competes with other users for a capped pool of capacity. Even if your plan’s stated limits would theoretically support your agent’s load, noisy neighbors can push you into congestion and degraded performance without triggering an explicit rate limit response.
Dedicated Nodes give your agent a node that no other user can access. No competing tenants. No noisy neighbor effects. Rate limits become a function of the node’s raw capacity, not a shared pool allocation. For production agentic systems, dedicated infrastructure is the appropriate default.
Chainstack also exposes usage controls directly in the dashboard: you can set quotas to cap your agent’s request volume, get email alerts before each threshold is reached, and lift all limits via pay-as-you-go when your agent is generating value and you don’t want the infrastructure to become the bottleneck.
Why P99 latency matters more than P50 for agents
For agents, the tail latency — P99, the slowest 1 in 100 responses — is more operationally significant than the median. An agent executing a multi-step reasoning chain waits for each RPC response before proceeding. The probability of hitting at least one P99 response in a 20-call chain is approximately 18%. In a 100-call chain, it is nearly 63%.
| Chain length | P99 hit probability | Practical impact |
|---|---|---|
| 5 calls | ~5% | Occasional slowdown |
| 20 calls | ~18% | Noticeable in production |
| 50 calls | ~40% | Frequent latency spikes |
| 100 calls | ~63% | Consistent degraded performance |
When evaluating node providers, ask for P99 latency data, not just average or P50. Global Nodes with geographic routing reduce P99 by routing each request to the lowest-latency regional node rather than sending all traffic to a single datacenter.
Archive nodes and Debug & Trace APIs for agents that need historical data
Without archive access, any eth_call with a block number more than 128 blocks in the past returns an error on a full node. Agents that mix real-time execution with historical analysis need archive access — and they should verify it before building the workflow, not after.
Chainstack supports archive nodes across chains and exposes the full Debug & Trace API suite. These cost 2 RUs per call instead of 1 — plan accordingly. The tradeoff is worth it for agents doing deep analysis: debug_traceTransaction, debug_traceBlock, and similar methods give your agent low-level execution traces that enable advanced reasoning on on-chain events.
Built-in health checks for agent-aware infrastructure
Chainstack exposes all standard health check endpoints so your agent can monitor node state in real time. An agent can call eth_syncing on any supported chain to check sync status, or query the Chainstack platform status API directly to verify overall platform health. This gives your agent real-time awareness of the infrastructure it depends on — and the ability to route around degraded nodes automatically.
Multi-chain agents
An agent operating across multiple chains needs a separate RPC endpoint per chain. The practical solution is a chain-keyed endpoint map with separate connection pools per chain:
CHAIN_ENDPOINTS = {
    "ethereum": os.getenv("ETH_RPC_URL"),
    "polygon":  os.getenv("POLYGON_RPC_URL"),
    "arbitrum": os.getenv("ARBITRUM_RPC_URL"),
    "base":     os.getenv("BASE_RPC_URL"),
    "bnb":      os.getenv("BNB_RPC_URL"),
}

def get_provider(chain: str) -> Web3:
    url = CHAIN_ENDPOINTS.get(chain)
    if not url:
        raise ValueError(f"No endpoint configured for chain: {chain}")
    return Web3(Web3.HTTPProvider(url))
Chainstack supports 70+ chains including Ethereum, Solana, Base, Polygon, Arbitrum, BNB Smart Chain, Hyperliquid, Monad, MegaETH, and more — so your multi-chain agent can use a single provider across the entire stack rather than stitching together endpoints from different vendors with inconsistent reliability and pricing models.
5. Chainstack for agentic AI
Dedicated nodes: no rate limits, predictable throughput
Dedicated Nodes provision a node exclusively for your use. No rate limits imposed by competing tenants. No noisy neighbor effects. Throughput is bounded only by the underlying hardware, which is documented and consistent.
For production agents running continuous workflows, this is the only infrastructure model that gives you predictable capacity planning. You know what the node can handle, you can measure your agent’s actual load against that capacity, and you can scale predictably.
Global nodes with geo-routing
Global Nodes route each request to the lowest-latency regional node based on the source of the request. For agents deployed across multiple regions — or for teams that want to reduce P99 latency without provisioning dedicated infrastructure — geo-routing provides a meaningful improvement without additional configuration complexity.
Transparent, predictable pricing
Chainstack measures usage in Request Units (RUs): a standard full-node call costs 1 RU; an archive or Debug & Trace call costs 2 RUs. No per-method pricing tables with hundreds of entries. For agentic workloads where cost predictability matters as much as performance, this simplicity is a material advantage.
You can set usage quotas in the dashboard to cap your agent’s spend, and receive email alerts before each threshold is reached. When your agent is ready for production and generating value, you can enable pay-as-you-go to remove limits entirely.
The Chainstack MCP server
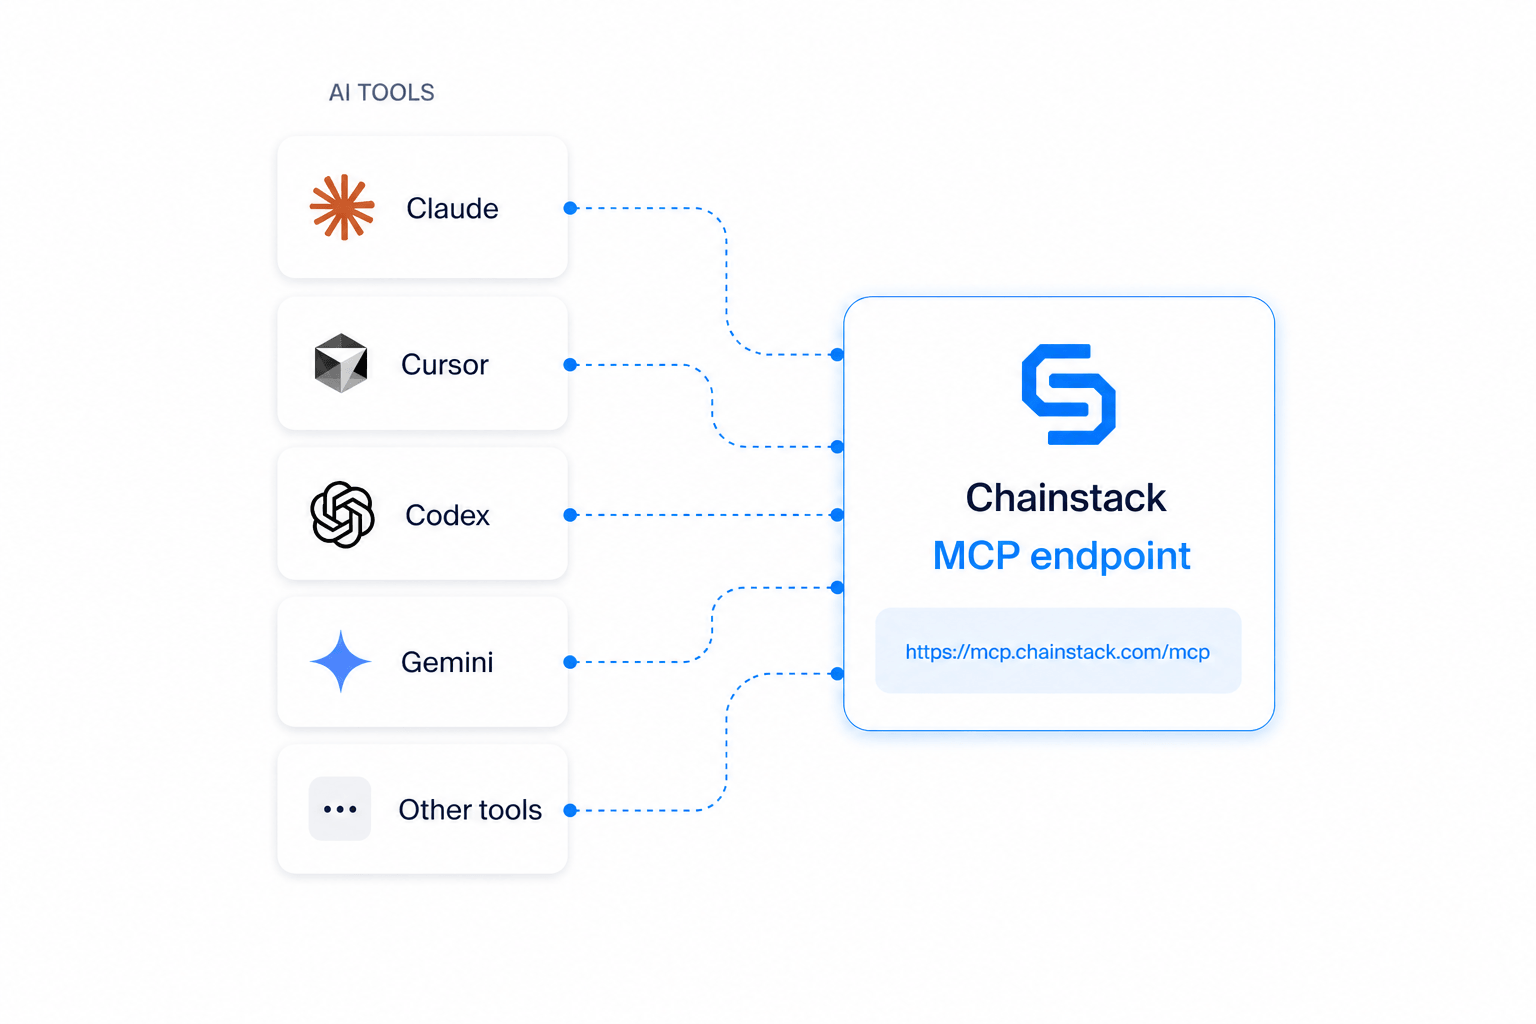
The Chainstack MCP server connects AI coding assistants directly to live blockchain infrastructure. It runs at https://mcp.chainstack.com/mcp — no local installation, no package install, no Docker image required.
It works with Claude Code, Claude Desktop, Claude.ai, Cursor, Windsurf, OpenAI Codex, Gemini CLI, and any other assistant that supports HTTP MCP transport.
Five tools work without any authentication:
| Tool | What it does |
|---|---|
search_docs | Search Chainstack documentation — RPC methods, deployment guides, code examples |
get_doc_page | Fetch the full content of any documentation page |
get_platform_status | Check live platform and network health across all supported chains |
get_chainstack_pricing | Retrieve current pricing data for any plan or node type |
contact_chainstack | Route questions directly to the Chainstack team |
With a Chainstack API key, your agent also gets full node lifecycle management: deploy Global Nodes or Dedicated Nodes, inspect their status, get live RPC endpoints, and delete them when done — all from a single prompt.
Connecting to Claude Code (one line):
claude mcp add --transport http chainstack https://mcp.chainstack.com/mcp --scope user
Connecting to Codex CLI:
codex mcp add chainstack --url https://mcp.chainstack.com/mcp
Connecting to Cursor or Windsurf — add to your MCP config file:
{
  "mcpServers": {
    "chainstack": {
      "transport": "http",
      "url": "https://mcp.chainstack.com/mcp"
    }
  }
}
Once connected, your coding assistant can deploy a Solana mainnet node and return a live endpoint in under a minute, query ETH balances or trace transactions inline, and search Chainstack docs for verified RPC method parameters — eliminating hallucinated method names and guessed parameter formats.
Conclusion: infrastructure checklist for on-chain AI agents
If your team is building an agent that makes real on-chain calls, run through this before going to production.
- Calculate RU consumption per workflow run — 1 RU per full-node call, 2 RUs per archive or Debug & Trace call. Add a 3x buffer for burst spikes.
- Implement exponential backoff with jitter on all RPC calls. Test 429 handling explicitly in staging.
- Use JSON-RPC batch requests for multi-variable reads. Replace polling with WebSocket subscriptions where latency matters.
- For production: Dedicated Nodes. For latency-sensitive workloads: Global Nodes with geo-routing.
- Verify archive node access before building historical workflows, not after.
- Set usage quotas and alerts in the Chainstack dashboard. Track RU consumption per run to catch cost drift early.
Connect your AI agent to Chainstack — no rate limits, no surprises.
Dedicated Nodes for production agentic workloads. Global Nodes for global low-latency access. Archive and Debug & Trace API support across 70+ chains.
FAQ
Dedicated Nodes are provisioned exclusively for you — no competing tenants, no shared rate limits. Global Nodes are geo-balanced shared infrastructure that routes each request to the lowest-latency regional node. For production agents where predictable throughput is critical, Dedicated Nodes are the right default. For agents where latency reduction matters more than isolation, Global Nodes with geo-routing are a strong choice.
In Request Units (RUs). A standard full-node call = 1 RU. An archive node request or Debug & Trace API call = 2 RUs. You can monitor usage in real time via the dashboard, set quotas to cap spend, and enable pay-as-you-go to remove limits when your agent is in production.
Yes. With a Chainstack API key, your agent can create, inspect, and delete both Global Nodes and Dedicated Nodes on any supported chain via the Chainstack MCP server. Nodes deployed via MCP appear in your Chainstack console exactly like any manually created node.
Full simulation support: eth_simulateV1 and eth_call for EVMs, simulateTransaction for Solana, and full forking with Foundry. This lets agents increase inference time — simulate before they execute — without being constrained by the RPC layer.
No. The Chainstack MCP server runs as a remote Streamable HTTP server at https://mcp.chainstack.com/mcp. Any AI assistant that supports HTTP MCP transport connects directly — no binary download, no package install, no Docker image required. It works with Claude Code, Cursor, Windsurf, Codex, Gemini CLI, and others.
70+ chains including Ethereum, Solana, Base, Polygon, Arbitrum, BNB Smart Chain, Hyperliquid, Monad, MegaETH, Avalanche, Aptos, and more. See the full list at chainstack.com/protocols.
Related reading