AI-ready infrastructure
 Refer and earn


 Ethereum
 Hyperliquid
 Solana
 Arbitrum
 BNB Smart Chain
 Base
Base Polygon
 TRON
TRON Sui
Sui Robinhood


Solana RPC on Chainstack in 2026: higher limits, GPA and more

If you tried Chainstack for Solana earlier and moved on, it was probably for one of three reasons:
- a method hit a rate limit under real traffic;
- a
getProgramAccountscall never finished; - you ran out of concurrent Yellowstone streams.
We spent the last few months on exactly those problems. This is the story of what we changed, why, and the numbers that came out of it.
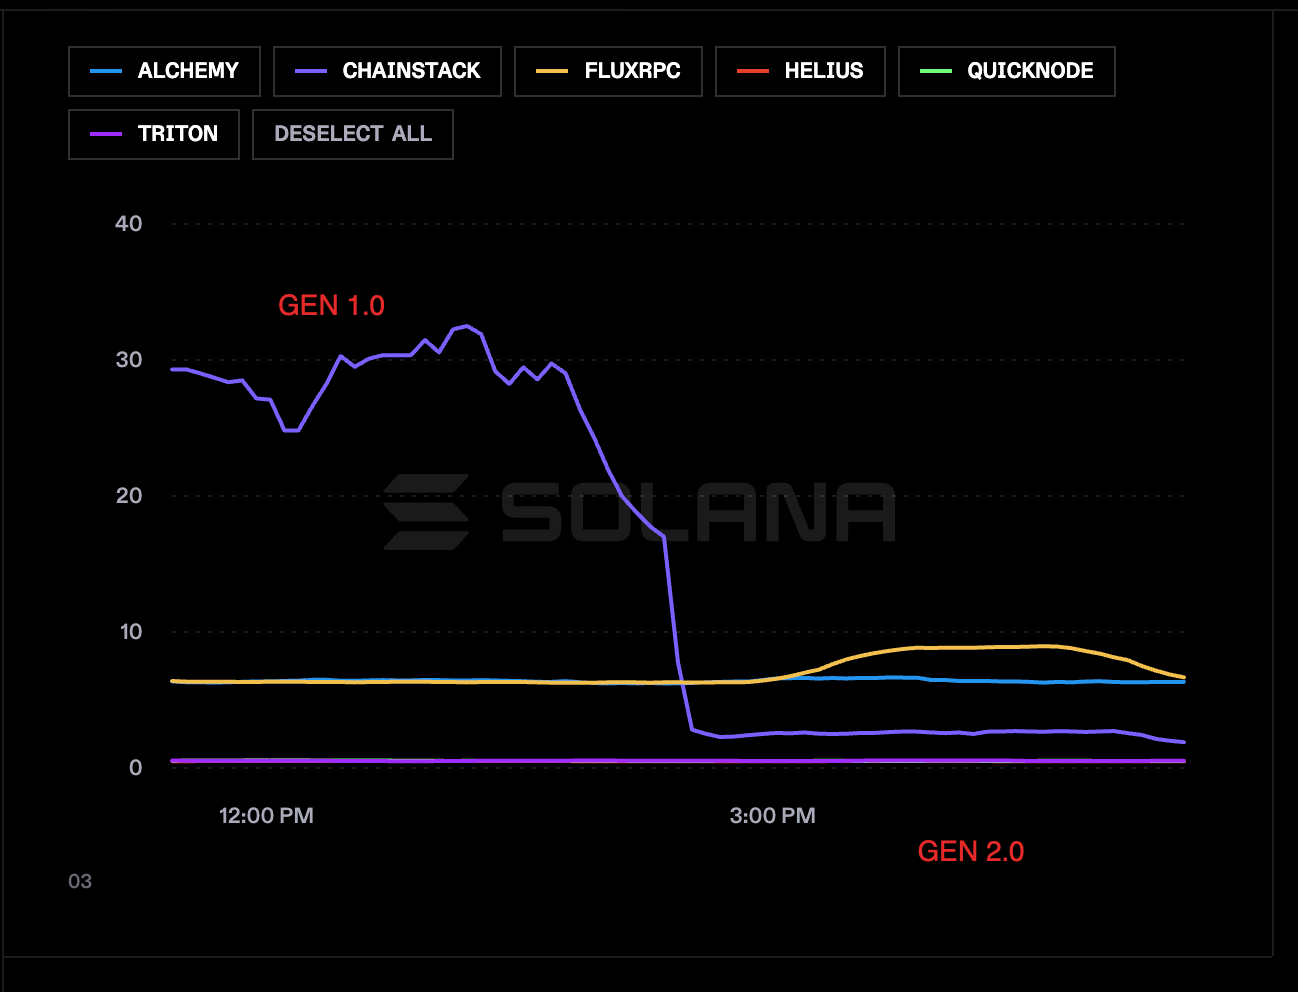
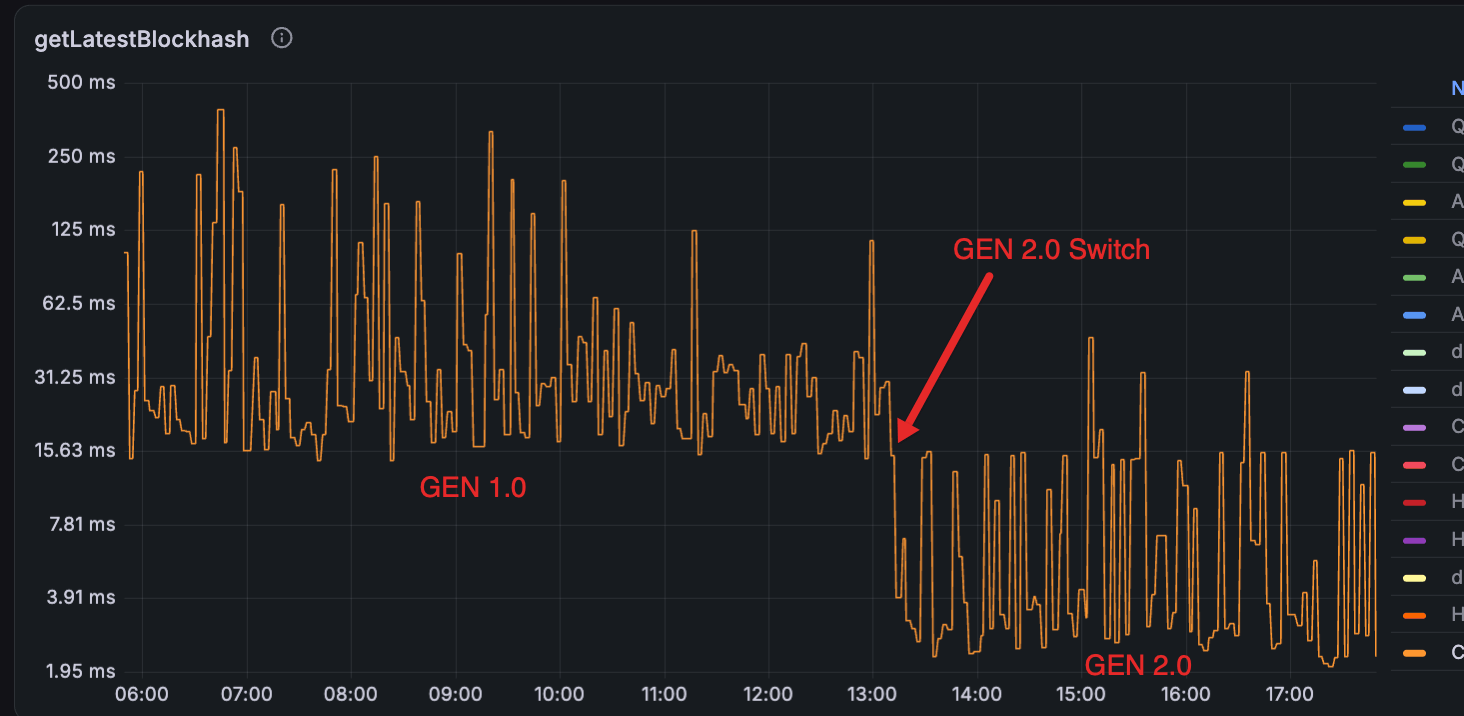
One number sums it up: median getLatestBlockhash latency in Chainstack Cloud Frankfurt dropped from about 17 ms to about 2 ms once we moved Solana to our new architecture.
TL;DR
- Architecture. Solana Mainnet Global Nodes now run entirely on GEN 2.0, and the extra proxy hop is gone.
- Routing and limits. Each method goes to a node pool built for it. That raised per-method limits, for example
getSupplyfrom 2 to 300 RPS. getProgramAccounts. Limits depend on program size and reach 20 RPS on small programs. A cache picks up popular programs automatically.- Scans. A scan that runs too long aborts with a clear error instead of hanging.
- Nodes. Global Nodes run a newer client, the main clusters moved to new hardware, and the most common heavy reads are much faster.
- Shred feed. Gaps dropped to roughly a third of what they were.
- Yellowstone gRPC. The lower plans include more concurrent streams.
Why we rebuilt our Solana infrastructure
Solana is hard on shared infrastructure. A handful of heavy methods can starve everything else on the same node, so adding more nodes of the same kind never fixed the real problem.
When we traced it, the cause was not capacity, it was contention. On an RPC node, an expensive indexed scan can hold the account-index lock, which stalls the index’s own updates, and tie up the node’s RPC worker threads so every other request queues behind it. We watched getTokenAccountsByOwner sit at an 18-second weighted-mean response time, with p99 pegged at the 30-second mark, while basic methods on the very same node answered in 20–40 ms. A customer’s trading system marked the endpoint unhealthy after 5 seconds and failed all traffic over to another provider.
That finding shaped everything below. The goal was simple: make Solana stable first, then raise the limits safely.
What changed: 8 key improvements for Solana
1. Solana is fully on GEN 2.0: latency from tens of milliseconds to about 2 ms
Solana Mainnet Global Nodes now run entirely on GEN 2.0, our new Global Node architecture. Every region that serves Solana RPC is on the new stack, and all Solana traffic is served on the new path.
The old stack sent your request through an edge proxy layer before it reached the node, and that layer alone added about 15 ms in Frankfurt. GEN 2.0 removes it: DNS sends your request to the nearest healthy region, and it goes straight to our load balancer, where method-aware routing (see below) picks the right pool. The Frankfurt median came out about 9x lower. Other regions vary. The Frankfurt figures come from the public Solana RPC latency monitor; the Chainstack Compare dashboard shows a blended view across methods. Both also show tail latency (p95 and p99), which is spikier than the median and still varies by region.
2. Method-aware routing: getSupply from 2 to 300 RPS
Capacity used to scale per node. A cheap call like getBlockTime and a heavy one like getSupply shared the same pool, so the heavy method set the ceiling for everything.
We split Solana into separate node pools and send each method to the pool that fits it:
- Scan pool. The heavy scan methods run here:
getProgramAccounts,getTokenAccountsByOwner,getTokenAccountsByDelegateandgetSupply. - General pool. Almost everything else, including
getLatestBlockhashandgetSlot.
A burst of heavy scans now slows your light calls much less. In our tests, light methods kept answering in tens of milliseconds while scans were busy.
Isolation also let us raise per-method limits we could never touch before, because a heavy method can no longer take the whole node down with it. We removed the per-region overrides too, so the limits are the same in every region.
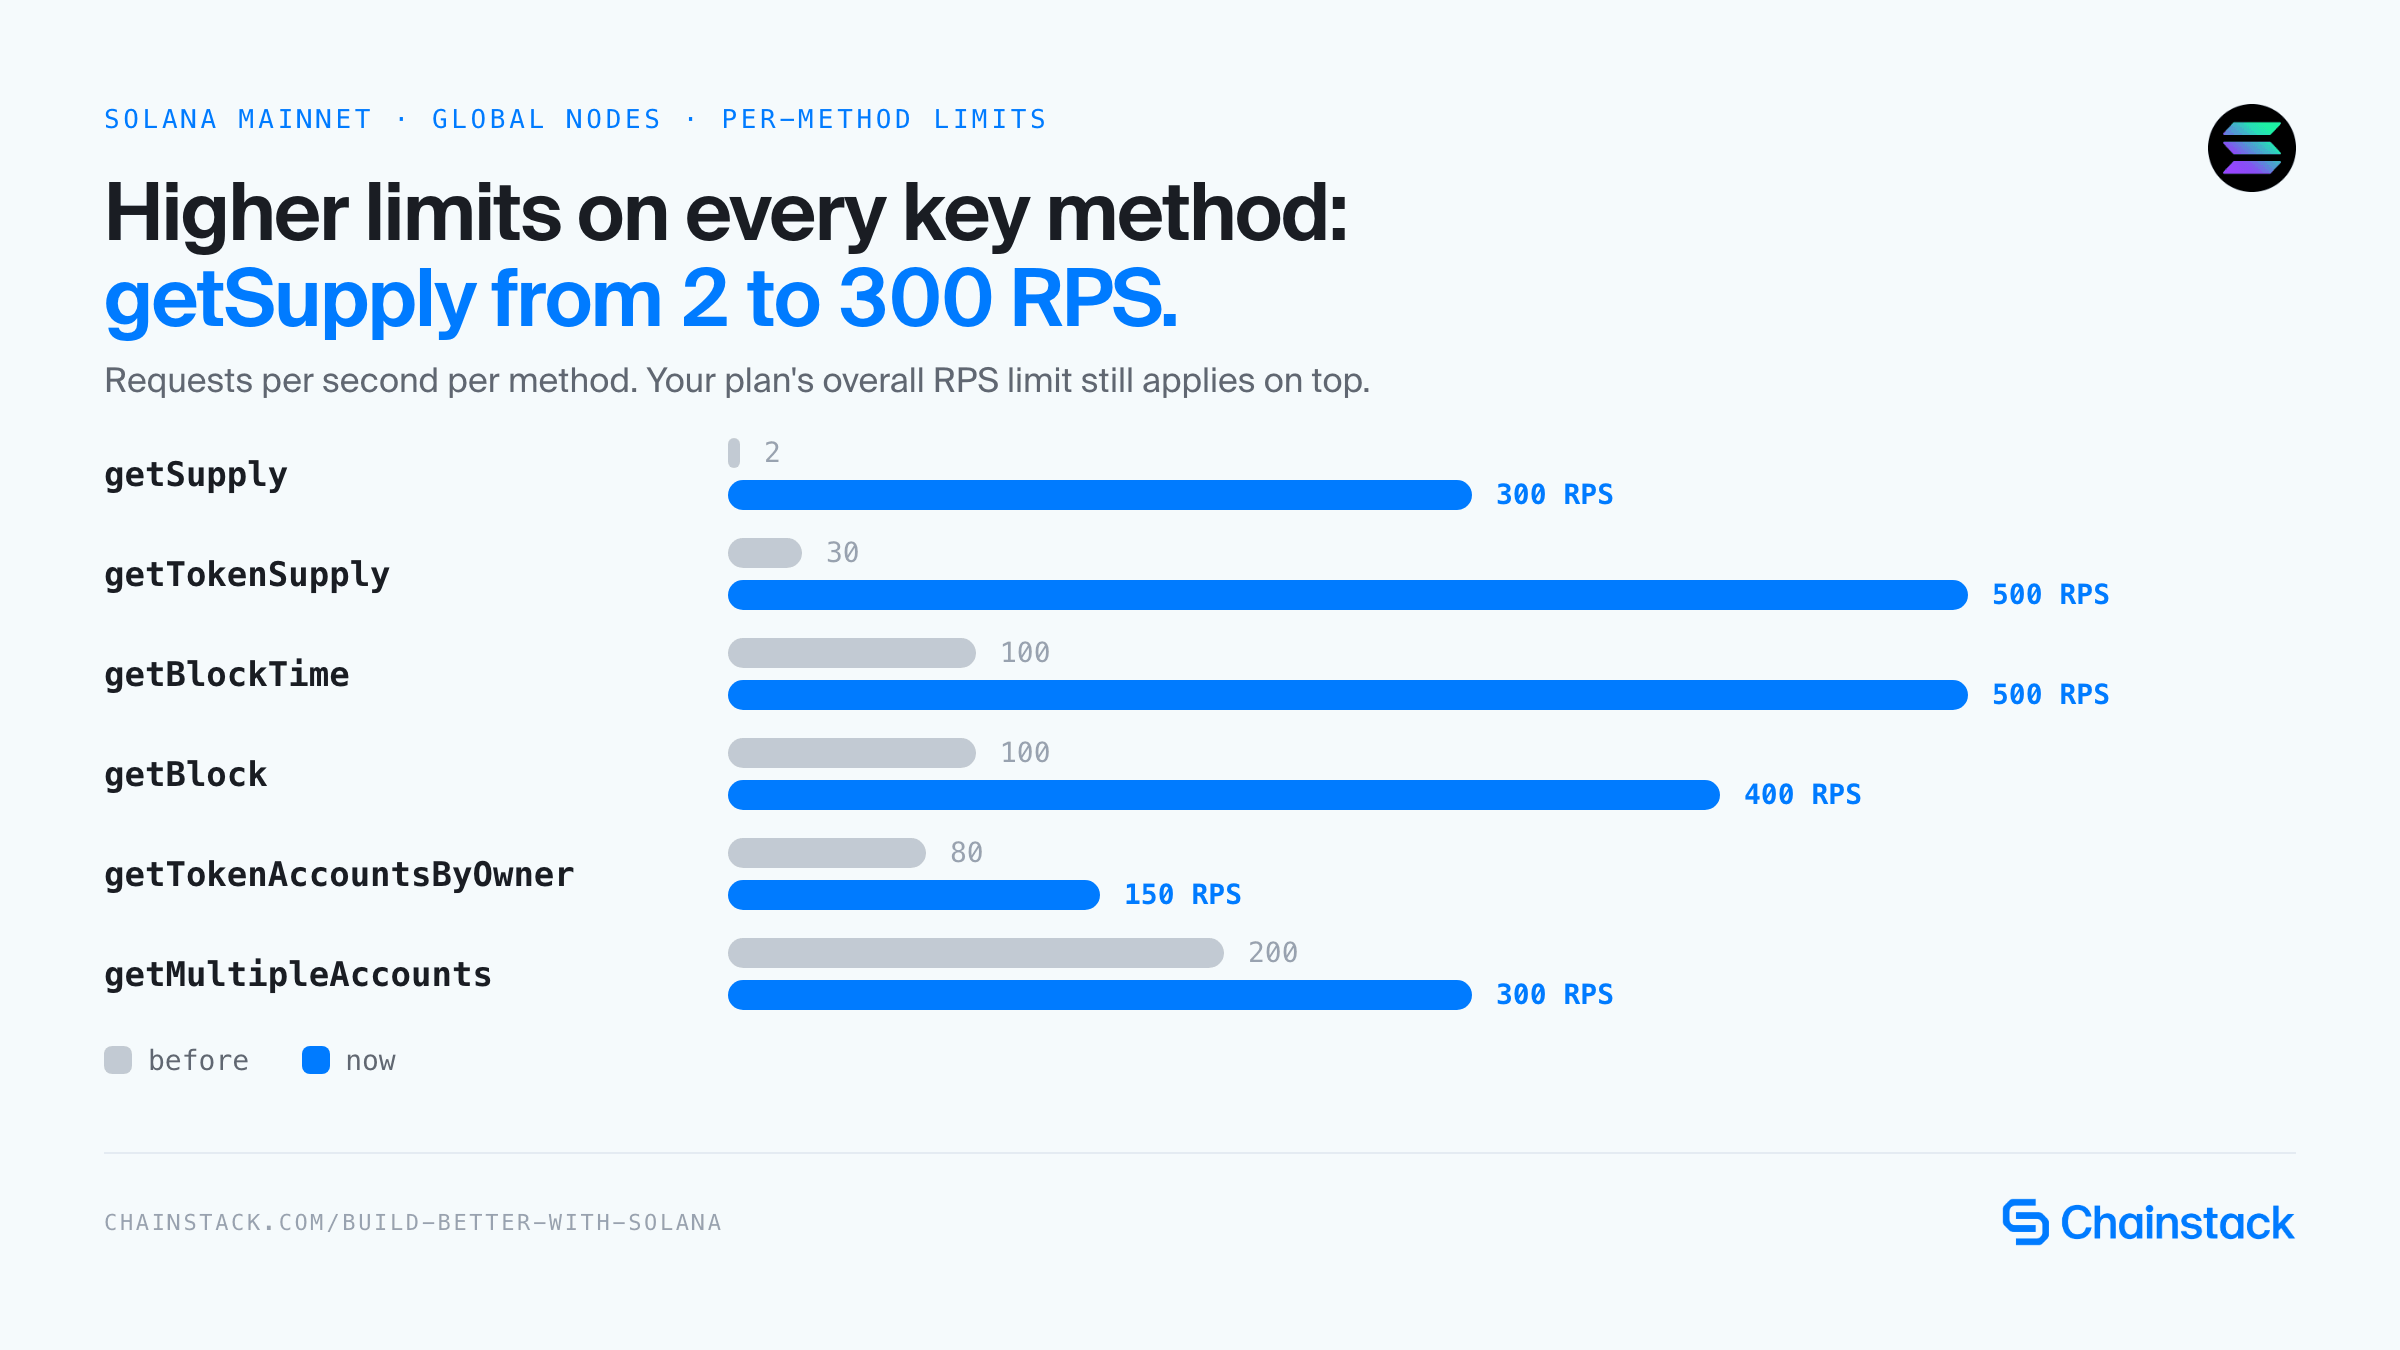
The biggest jump is on the heaviest method: getSupply went from 2 to 300 RPS. These are per-method limits on Solana Mainnet Global Nodes, and your plan’s overall RPS limit still applies on top.
3. getProgramAccounts: rebuilt indexes and a cache that learns
getProgramAccounts failed most often, so it got the most work. We rebuilt the account indexes in-house and preload them at node startup, then layered a cache on top that we improved in three stages.
- Stage 1, the pilot. We hand-picked the most popular programs, force-indexed them and served them at finalized commitment.
- Stage 2, add confirmed. We extended the cache to serve confirmed alongside finalized. A trading or monitoring workload could now read confirmed state instead of waiting for finalized.
- Stage 3, selective auto-cache. The cache now picks up programs that get repeated requests, automatically, with no hand-curated list. It is updated from a live gRPC stream and serves cached responses from each region. Because the cache takes load off the nodes, other methods benefit too, with less contention.
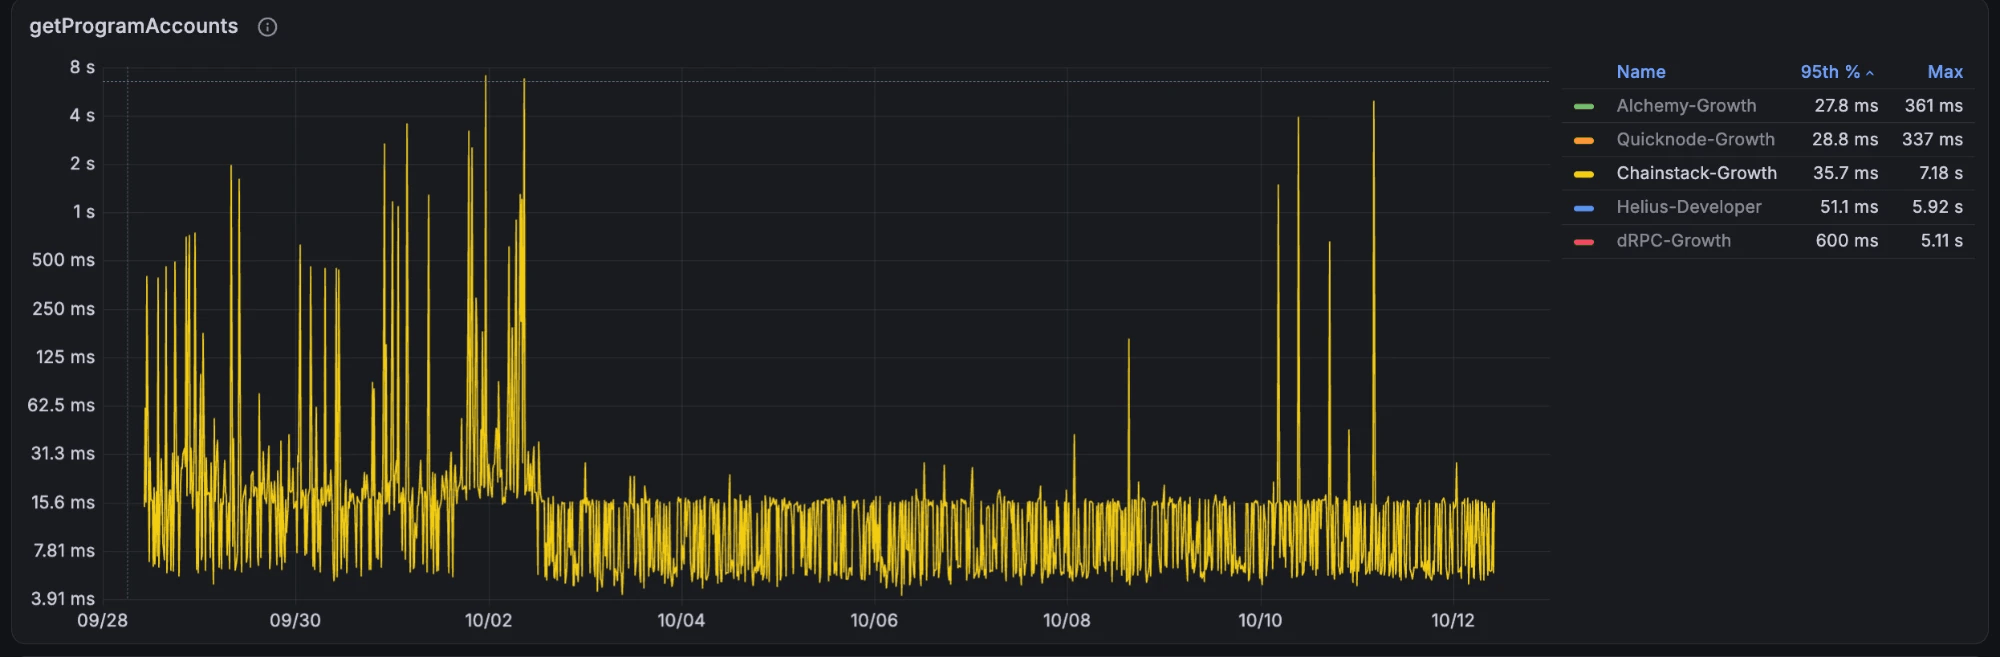
A few rules worth knowing:
- Cached responses are served at confirmed and finalized. Requests at processed commitment always go to a node.
- If a program is not cached yet, the request goes to a node as before.
- Unfiltered calls to large programs such as Token-2022 are rejected with error
-32602, and the Token Program itself is excluded from indexing and returns error-32010. For token balances, usegetTokenAccountsByOwnerinstead.
4. getProgramAccounts: limits by program size
A program with a handful of accounts and a program with hundreds of millions used to be treated the same. Limits are now set per program by size, and requests with filters get a higher limit than requests without. Every size bucket used to be clamped to 1 RPS. Here is the before and after.
| Program size (accounts) | With filters (before → now) | Without filters (before → now) |
|---|---|---|
| Under 10K | 1 → 20 RPS | 1 → 10 RPS |
| 10K–30K | 1 → 15 RPS | 1 → 5 RPS |
| 30K–60K | 1 → 15 RPS | 1 → 3 RPS |
| 60K–200K | 1 → 15 RPS | 1 → 2 RPS |
| 200K–500K | 1 → 10 RPS | 1 → 2 RPS |
| 500K–1M | 1 → 5 RPS | 1 → 2 RPS |
| 1M and more | 1 RPS → 3 requests per 20 seconds | 1 RPS → 2 requests per 20 seconds |
Large programs are now limited more tightly than before, and we would rather say that than hide it: a single scan of a program with a million or more accounts can occupy a node. Cached programs have their own, higher per-program limits.
5. Scans that abort in 60 seconds instead of hanging
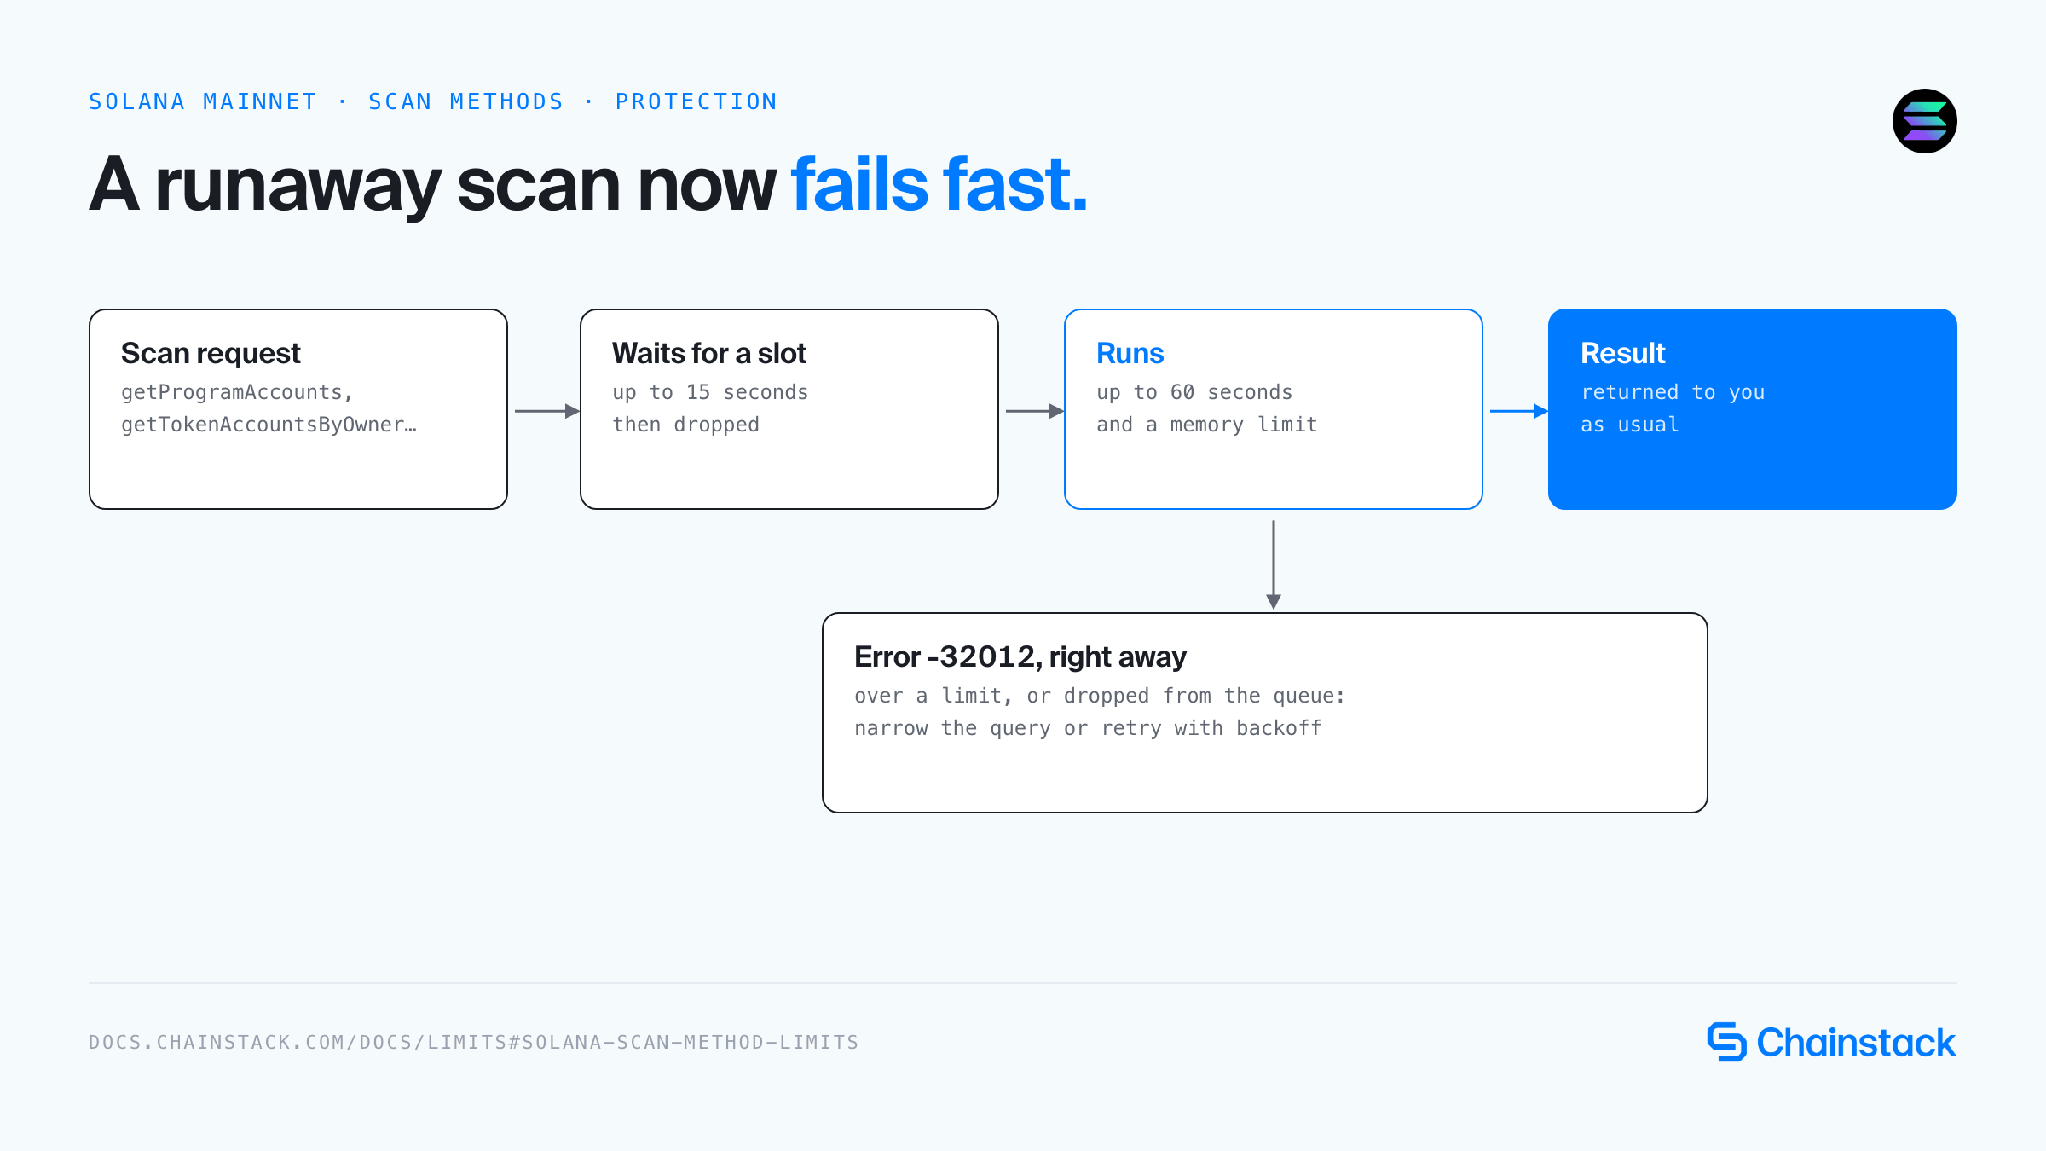
The scan methods now run under a 60-second execution limit and a per-request memory limit. The limits are enforced inside the node itself, with our own patches on top of Agave, so a scan stops at the source instead of being cut off by a proxy in front of it.
- Over either limit, a scan returns error
-32012right away. Before, it hung until your client timed out. - A scan that waits more than 15 seconds for a free slot is dropped with the same code, so you can retry it with backoff.
- A scan is cancelled as soon as your client disconnects, so abandoned requests no longer hold node resources. The same patch also makes
getMultipleAccountsfetch accounts in a single batch, which is faster for large requests.
Before turning this on, we checked two weeks of real traffic. Successful scans that take longer than 60 seconds were under 0.01% of all scan requests, and almost all longer scans were already failing on the client side. The limit turns a multi-minute hang into a fast, clear error.
6. Newer client, new hardware, faster heavy reads
Solana Mainnet Global Nodes now run Agave v4.3.0, tuned for RPC load: thread pools sized per node role, larger account caches and, on the scan pool, an account index that is preloaded at startup.
We also moved part of our Frankfurt, New York and Singapore capacity to new bare-metal servers (latest-generation CPUs, much more memory and faster networking) with striped NVMe storage, and began retiring the weakest clusters.
The preloaded index had the biggest effect on heavy reads. These are p95 figures from our own measurements at the time of the rollout:
| Method | p95 before | p95 after |
|---|---|---|
getProgramAccounts | 25–60 seconds | under 2 seconds |
getTokenAccountsByOwner | up to 2 minutes | about 1 second |
Some very large scans, for example scans of large programs filtered only by dataSize, can still take seconds. Narrow them with memcmp filters.
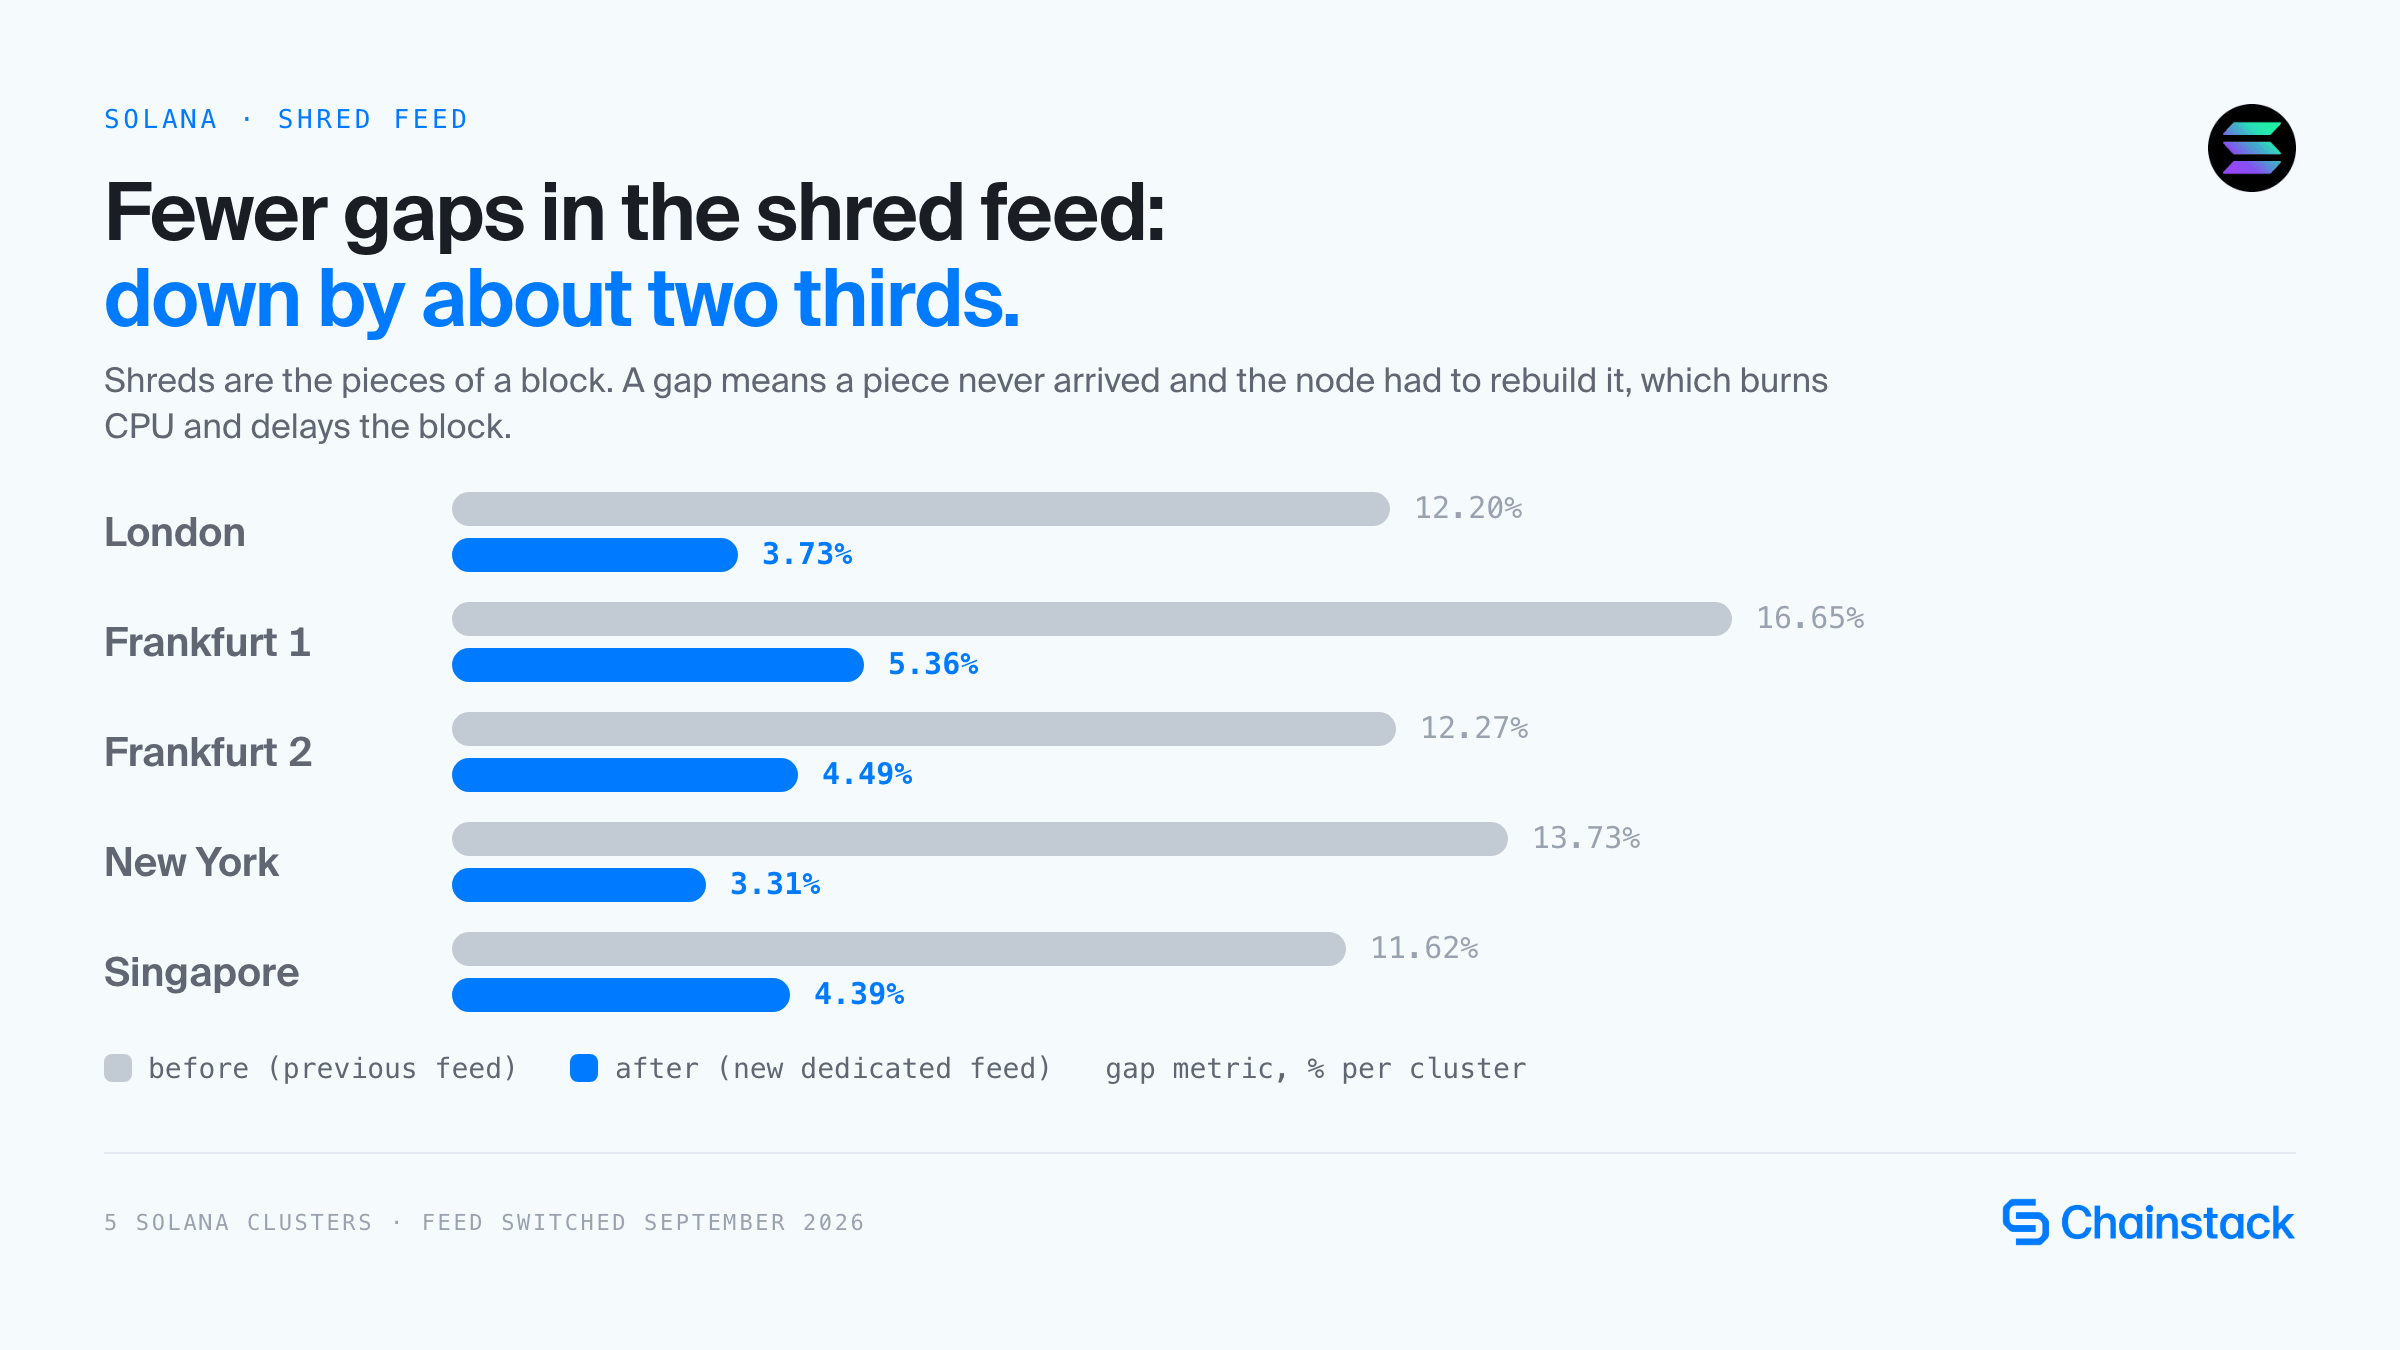
7. A steadier shred feed: gaps down from 12–17% to 3–5%
Shreds are the pieces of a block that arrive through Solana’s block-distribution network. When a piece never arrives, the node has to repair or reconstruct it, which burns CPU and delays the block reaching your requests. A dedicated shred feed fills those gaps.
We moved to a new dedicated shred feed across five clusters, with no node restarts and no customer impact. The share of block data the node had to rebuild itself dropped on every cluster.
| Cluster | Gap before | Gap after |
|---|---|---|
| Chainstack Cloud London | 12.20% | 3.73% |
| Chainstack Cloud Frankfurt 1 | 16.65% | 5.36% |
| Chainstack Cloud Frankfurt 2 | 12.27% | 4.49% |
| Chainstack Cloud New York | 13.73% | 3.31% |
| Chainstack Cloud Singapore | 11.62% | 4.39% |
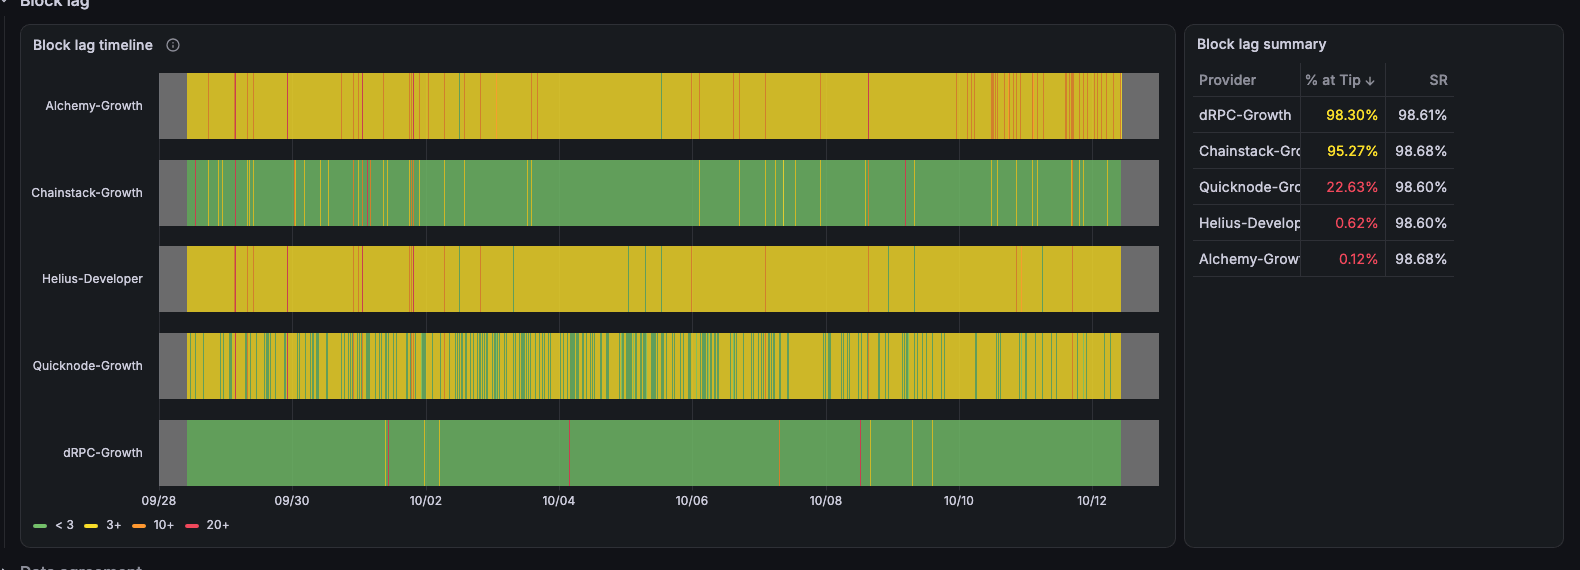
For an outside view, look at block lag on our public Grafana dashboards for the EU, US West and Asia probes. From September 28 to October 12, Chainstack nodes were at the chain tip (block lag under 3 slots) 95% of the time when measured from the EU, 61% from Asia (Singapore) and 57% from US West. Chainstack ranked second in every region, behind one provider and far ahead of the other three. These are probe measurements, so treat them as indicative. The measurement covers the whole stack, so it does not isolate the shred feed, but it shows how current the data is when your request arrives.
8. Yellowstone gRPC: 2, 7, and 25 concurrent streams
If Yellowstone gRPC limits pushed you away, the plans now include more concurrent streams:
| Yellowstone add-on tier | Streams before | Streams now |
|---|---|---|
| $49 per month | 1 | 2 |
| $149 per month | 5 | 7 |
| $449 per month | 25 | 25 (unchanged) |
Here is why this matters. Some gRPC clients update their filters by tearing down a subscription and opening a new one every few minutes. At a one-stream limit, there is no room to hold the old stream open while the new one comes up, so the reconnect drops data. Two concurrent streams give that overlap. The higher tiers are for workloads that track many programs and accounts across more parallel streams.
Stream events are unlimited on all three tiers, and Yellowstone is available on Solana Mainnet from the Growth plan.
A client that briefly disconnects can also catch up: on Global Nodes, from_slot replays roughly the last 100 slots from a server-side buffer. It is a recovery tool, not a historical backfill. Dedicated Nodes can be configured with a deeper buffer.
What is still ahead
We are indexing the next group of heavier methods so their limits can rise too, and we are continuing to improve Yellowstone streaming. We will publish those changes the same way, with the numbers.
Get started with Solana on Chainstack
Start free: the Developer plan includes 3M Request Units a month, and it is the quickest way to try Solana on Chainstack. To rerun the heavy scans and streams that failed for you, you need a paid plan, because getProgramAccounts, getSupply, getTokenAccountsByOwner and Yellowstone gRPC are not on Developer.
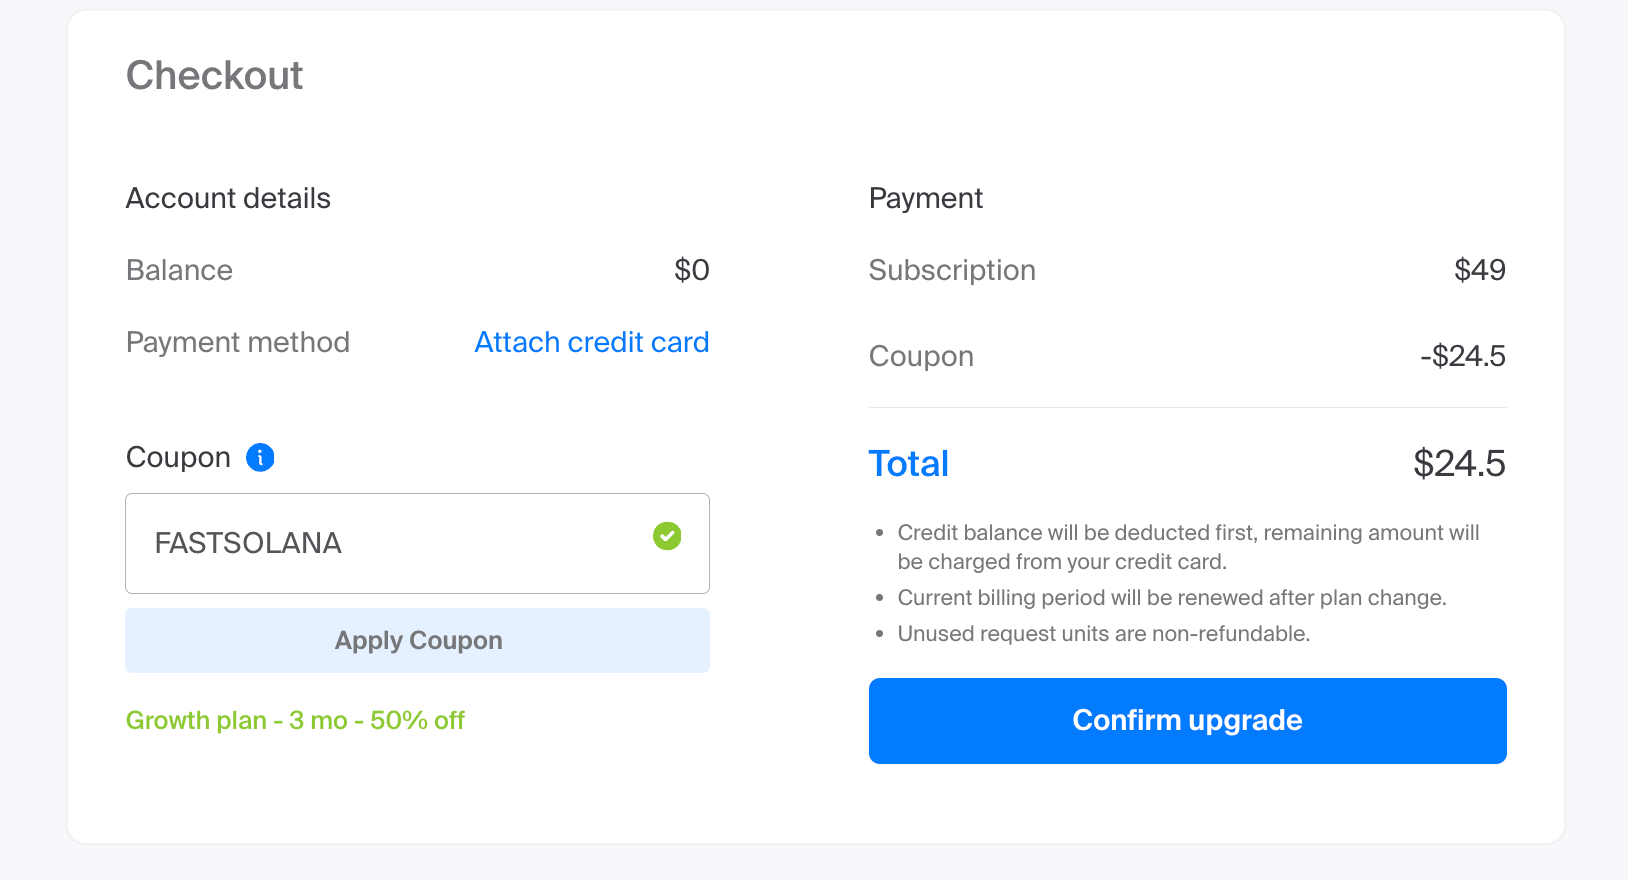
Use the promo code FASTSOLANA at checkout to get 50% off the Growth plan for 3 months.
Solana Mainnet is limited to 5 RPS on the Developer plan and 50 RPS on Growth. If you need steady throughput without watching Request Units, the Unlimited Node add-on is a flat monthly fee tied to an RPS tier, available from the Growth plan.
FAQ
They are set per method on Solana Mainnet Global Nodes, for example 500 RPS for getBlockTime, 400 for getBlock and 300 for getMultipleAccounts. getProgramAccounts depends on program size. Your plan limit also applies: 5 RPS on Developer and 50 RPS on Growth for Solana Mainnet. Requests over a limit return HTTP 429 with error -32005, and a getProgramAccounts request to a program with no assigned size tier is limited to 2 RPS.
getProgramAccounts request return error -32012? One of three things happened: the scan ran longer than 60 seconds, it used more memory than the per-request limit, or it waited more than 15 seconds for a free scan slot. Narrow the query with dataSize or memcmp filters. If the request was dropped from the queue, retry with exponential backoff.
getProgramAccounts on the SPL Token Program? Not directly. The Token Program is excluded from indexing and returns error -32010, and unfiltered requests to large programs such as Token-2022 are rejected with error -32602. Use getTokenAccountsByOwner to read token balances.
getProgramAccounts at processed commitment cached? No. Cached responses are served at confirmed and finalized. Processed requests always go to a node and count against the size-tier limits.
The $49 per month plan includes 2 concurrent streams, the $149 per month plan includes 7 and the $449 per month plan includes 25. Stream events are unlimited, and Yellowstone is available from the Growth plan on Solana Mainnet.
Reconnect with from_slot set to the last slot you processed. Global Nodes keep about the last 100 slots, under a minute. For older data, use getBlock, getSignaturesForAddress or getTransaction.
Yes. The Developer plan is free and includes 3M Request Units a month. These require a paid plan: Yellowstone gRPC, getProgramAccounts, getSupply, getTokenAccountsByOwner and the Unlimited Node add-on.
Additional resources
- Throughput guidelines: current Solana limits, including
getProgramAccountstiers and scan limits - Yellowstone gRPC Geyser plugin: plans, streams and replay
- Unlimited Node: flat-fee RPS tiers
- Build better with Solana: Chainstack Solana RPC nodes
- Pricing: plans and add-ons
- Global Nodes: shared, auto-scaling Solana endpoints
- Dedicated Nodes: isolated capacity for heavy workloads
- Chainstack Compare: public RPC performance dashboard
- Solana data: public RPC latency monitor on solana.com