AI-ready infrastructure
 Refer and earn


 Ethereum
 Hyperliquid
 Solana
 Arbitrum
 BNB Smart Chain
 Base
 Polygon
 TRON
 Sui
 Robinhood


Arc RPC Provider Benchmark: Latency & Uptime (November 2026)

Data source: Chainstack Compare for Arc and the Grafana dashboard pinned to this window. Window: 7 days, Nov 5, 2026, 14:06 UTC to Nov 12, 2026, 14:06 UTC. Captured Nov 12, 2026, 14:06 UTC.
Disclosure: Chainstack runs the probes, the dashboard, and the scoring formula behind this report, and Chainstack is one of the four providers ranked. The collection code is open source in the compare-dashboard-functions repository.
Abstract
This report ranks four Arc RPC provider endpoints (Chainstack, Quicknode, Alchemy, and dRPC) on latency and uptime over the 7 days ending Nov 12, 2026, measured from three regions. Chainstack has the lowest score on Arc at 0.050, and Quicknode is second at 0.095. Chainstack does not lead every column: Quicknode has the lowest P95 in DE at 18 ms, and Alchemy has the lowest P95 in the US at 19 ms.
Key findings
- Chainstack has the lowest Arc score, 0.050. Quicknode follows at 0.095, Alchemy at 0.127, and dRPC at 0.296. The Quicknode score is 91% above the Chainstack score.
- Chainstack has the lowest P50, P95, and P99 on Arc, at 20 ms, 49 ms, and 85 ms. dRPC is second on P50 at 41 ms, and Quicknode is second on P95 and P99, at 94 ms and 112 ms.
- Quicknode has the lowest P95 from the DE probe, 18 ms. Alchemy follows at 19 ms, and Chainstack measures 48 ms from DE, 30 ms behind Quicknode.
- Alchemy has the lowest P95 from the US probe, 19 ms. Chainstack measures 50 ms from the US, 31 ms behind Alchemy, and leads only the SG probe, at 49 ms.
- Chainstack, Quicknode, and Alchemy tie on availability at 99.99%. dRPC measures 99.98%, and all four providers had at least one failed request in the window.
Arc RPC provider comparison: latency and uptime
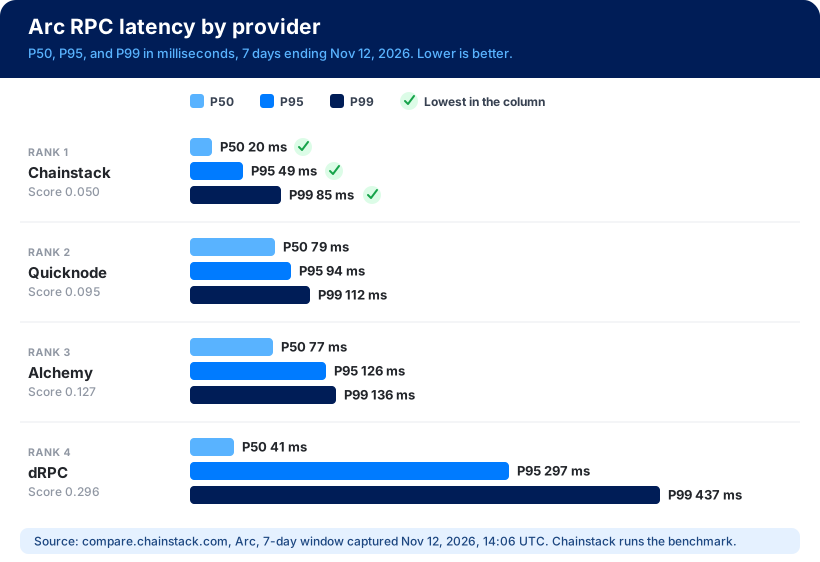
| Rank | Provider | Plan | Score | Availability | P50 | P95 | P99 | DE P95 | US P95 | SG P95 | Best for |
|---|---|---|---|---|---|---|---|---|---|---|---|
| 1 | Chainstack | First paid plan | 0.050 | 99.99% | 20 ms | 49 ms | 85 ms | 48 ms | 50 ms | 49 ms | Lowest score, P50, P95, and P99; lowest P95 in SG |
| 2 | Quicknode | Growth | 0.095 | 99.99% | 79 ms | 94 ms | 112 ms | 18 ms | 93 ms | 171 ms | Lowest P95 in DE |
| 3 | Alchemy | Growth | 0.127 | 99.99% | 77 ms | 126 ms | 136 ms | 19 ms | 19 ms | 341 ms | Lowest P95 in US |
| 4 | dRPC | First paid plan | 0.296 | 99.98% | 41 ms | 297 ms | 437 ms | 103 ms | 480 ms | 309 ms | – |
Lower is better in every column except availability. The table covers Arc for the 7 days from Nov 5, 2026, 14:06 UTC to Nov 12, 2026, 14:06 UTC, and bold marks the best value in each column, including the three providers tied on availability: Chainstack, Quicknode, and Alchemy.
The gap between first and second place on Arc reads two ways. The Quicknode score (0.095) is 91% above the Chainstack score (0.050), and the Chainstack score is 48% below the Quicknode score. Both figures describe the same 0.045 difference. Ranking the four Arc providers by score gives the same order as ranking them by P95.
Contents
- Abstract
- Key findings
- Arc RPC provider comparison: latency and uptime
- How the Arc RPC benchmark works
- Provider results: Chainstack vs Quicknode vs Alchemy vs dRPC
- Arc RPC latency by region
- Changes since the September 2026 edition
- Conclusion
- Frequently asked questions
- Appendix: measurement parameters
- Related reports
How the Arc RPC benchmark works
The figures in this report come from the Chainstack Compare dashboard for Arc, and the description below repeats what that dashboard documents.
Probes and cadence. A Python service on Vercel serverless functions sends requests to each Arc RPC provider every 1–3 minutes.
Regions. The service probes from three regions, which the Compare page labels DE, US, and SG. Each region counts equally in the Arc score.
Methods probed. The Arc dashboard measures eight RPC methods:
eth_calleth_getBalance(archive)eth_getLogseth_getTransactionReceiptdebug_traceTransactioneth_blockNumberdebug_traceBlockByNumbereth_subscribe
All requests use the latest blocks, except the archive method, which queries historical blocks from 1–2 days ago.
Failure rule. A response time above 55 seconds counts as a failure and is excluded from the latency charts.
Plan monitored. Unless the dashboard names a plan, the first paid plan of each RPC provider is monitored. The dashboard names Growth for Quicknode and Alchemy, and names no plan for Chainstack and dRPC.
Formula. The dashboard scores each provider with this formula, where a lower score is better:
Score = 1 / ((1/ResponseTime) × (SuccessRate³))The response time is the arithmetic mean of each method’s P95. eth_subscribe is excluded from that mean, because its latency reflects chain block cadence and not provider speed, but eth_subscribe still counts toward the success rate. Methods are weighted equally for latency, and the success rate uses sample counts. The score is computed per region and then averaged across the three regions, so one slow region cannot be hidden by fast ones. The score is in seconds, so 0.050 reads as 50 ms.
Window. The window is the dashboard’s rolling 7 days, ending at the capture time of Nov 12, 2026, 14:06 UTC.
Limits
- What is not measured. The Arc benchmark covers response time and success rate for the eight methods above from three regions. The benchmark does not measure throughput, rate limits, price, data correctness, support, or any method outside that list.
- Chainstack chose the formula. Chainstack designed the scoring formula and the method list, and Chainstack is ranked by them. A different formula or method mix could order the Arc providers differently.
- Roster. Only the four providers the dashboard monitors for Arc are ranked: Chainstack, Quicknode, Alchemy, and dRPC. Other Arc RPC providers are absent because the dashboard does not monitor them, not because of their results.
- One plan per provider. Chainstack, Quicknode, Alchemy, and dRPC are each measured on a single plan on Arc. Other plans of those providers may perform differently.
- Pinned link. The pinned Grafana link shows this exact window only while the dashboard retains the data. The live dashboard shows a newer window and its numbers will differ from this report.
Provider results: Chainstack vs Quicknode vs Alchemy vs dRPC
1. Chainstack on Arc
- Verdict: Chainstack ranks first on Arc with a score of 0.050, 48% below second-placed Quicknode.
- Leads: Chainstack leads P50 (20 ms), P95 (49 ms), P99 (85 ms), and SG P95 (49 ms), and ties Quicknode and Alchemy on availability at 99.99%.
- Trails: Chainstack is furthest behind from the US probe, at 50 ms against 19 ms for Alchemy, a 31 ms difference. Chainstack measures 48 ms from the DE probe against 18 ms for Quicknode, a 30 ms difference.
- Regional spread: Chainstack is quickest from DE at 48 ms and slowest from the US at 50 ms, a 1.0x spread, the narrowest of the four Arc providers.
2. Quicknode on Arc
- Verdict: Quicknode ranks second on Arc with a score of 0.095, 91% above Chainstack.
- Leads: Quicknode leads DE P95 (18 ms), and ties Chainstack and Alchemy on availability at 99.99%.
- Trails: Quicknode is furthest behind from the SG probe, at 171 ms against 49 ms for Chainstack, a 122 ms difference. Quicknode P50 is 79 ms, 59 ms behind Chainstack.
- Regional spread: Quicknode is quickest from DE at 18 ms and slowest from SG at 171 ms, a 9.5x spread.
3. Alchemy on Arc
- Verdict: Alchemy ranks third on Arc with a score of 0.127.
- Leads: Alchemy leads US P95 (19 ms), and ties Chainstack and Quicknode on availability at 99.99%.
- Trails: Alchemy is furthest behind from the SG probe, at 341 ms against 49 ms for Chainstack, a 292 ms difference. Alchemy P50 is 77 ms, 57 ms behind Chainstack.
- Regional spread: Alchemy is quickest from DE and the US at 19 ms each and slowest from SG at 341 ms, an 18.0x spread, the widest of the four Arc providers.
4. dRPC on Arc
- Verdict: dRPC ranks fourth on Arc with a score of 0.296.
- Leads: dRPC leads no column. dRPC availability is 99.98%, below the 99.99% of Chainstack, Quicknode, and Alchemy.
- Trails: dRPC is furthest behind from the US probe, at 480 ms against 19 ms for Alchemy, a 461 ms difference. dRPC P99 is 437 ms, 352 ms behind Chainstack.
- Regional spread: dRPC is quickest from DE at 103 ms and slowest from the US at 480 ms, a 4.7x spread.
Arc RPC latency by region
| Region | Lowest P95 on Arc | Provider |
|---|---|---|
| DE | 18 ms | Quicknode |
| US | 19 ms | Alchemy |
| SG | 49 ms | Chainstack |
Chainstack does not lead the DE probe on Arc. The DE P95 order is Quicknode at 18 ms, Alchemy at 19 ms, Chainstack at 48 ms, and dRPC at 103 ms.
Chainstack does not lead the US probe on Arc. The US P95 order is Alchemy at 19 ms, Chainstack at 50 ms, Quicknode at 93 ms, and dRPC at 480 ms.
From the SG probe, Chainstack leads Arc at 49 ms, followed by Quicknode at 171 ms, dRPC at 309 ms, and Alchemy at 341 ms.
Changes since the September 2026 edition
The September 2026 Arc edition used the same rolling 7-day window length. The September 2026 Arc edition does not state its window end date, only that the page was published Sep 21, 2026 and updated Sep 28, 2026, so the columns below are labeled by edition.
| Provider | Rank, September 2026 edition | Rank, Nov 12 | Score, September 2026 edition | Score, Nov 12 | P95, September 2026 edition | P95, Nov 12 | Availability, September 2026 edition | Availability, Nov 12 |
|---|---|---|---|---|---|---|---|---|
| Chainstack | 1 | 1 | 0.063 | 0.050 | 62 ms | 49 ms | 99.98% | 99.99% |
| Quicknode | 2 | 2 | 0.101 | 0.095 | 101 ms | 94 ms | 99.97% | 99.99% |
| Alchemy | 3 | 3 | 0.149 | 0.127 | 149 ms | 126 ms | 99.98% | 99.99% |
| dRPC | 4 | 4 | 0.224 | 0.296 | 238 ms | 297 ms | 99.88% | 99.98% |
Chainstack, Quicknode, Alchemy, and dRPC hold the same rank order on Arc in both editions. Two 7-day windows are two readings, not a trend.
Conclusion
Chainstack has the lowest score on Arc for the 7 days ending Nov 12, 2026, at 0.050, with Quicknode second at 0.095, which is 91% above Chainstack. The column to read depends on the workload:
- Typical request latency: read P50. Chainstack leads Arc at 20 ms, and dRPC follows at 41 ms.
- Tail latency: read P95 and P99. Chainstack leads Arc on both, at 49 ms and 85 ms.
- Users or servers in one region: read that region’s P95. Quicknode leads Arc from DE at 18 ms, Alchemy leads Arc from the US at 19 ms, and Chainstack leads Arc from SG at 49 ms.
- Uptime: read availability. Chainstack, Quicknode, and Alchemy all measured 99.99% on Arc, and dRPC measured 99.98%.
The standings move between windows, so check the live Arc standings on Chainstack Compare before relying on any figure in this report.
Frequently asked questions
Which Arc RPC provider has the lowest latency?
Chainstack has the lowest P50, P95, and P99 latency on Arc, at 20 ms, 49 ms, and 85 ms, for the 7 days ending Nov 12, 2026. Quicknode is second on Arc for P95 and P99, at 94 ms and 112 ms, and dRPC is second on Arc for P50 at 41 ms.
Which Arc RPC provider has the highest availability?
Chainstack, Quicknode, and Alchemy tie for the highest availability on Arc at 99.99% for the 7 days ending Nov 12, 2026. dRPC measured 99.98% on Arc, and each of the four providers had at least one failed request in the window.
Which Arc RPC provider has the lowest P95 in each region?
Quicknode has the lowest Arc P95 from DE at 18 ms, Alchemy has the lowest Arc P95 from the US at 19 ms, and Chainstack has the lowest Arc P95 from SG at 49 ms. Chainstack measures 48 ms from the DE probe and 50 ms from the US probe.
How is the Arc RPC benchmark score calculated?
The Chainstack Compare score is 1 / ((1/ResponseTime) × (SuccessRate³)), computed per region and averaged across the three regions, and a lower score is better. The response time is the mean of each method’s P95, excluding eth_subscribe. Chainstack scored 0.050 on Arc and dRPC scored 0.296.
Appendix: measurement parameters
| Parameter | Value |
|---|---|
| Chain | Arc |
| Providers ranked | Chainstack, Quicknode, Alchemy, dRPC |
| Plans monitored | Quicknode Growth, Alchemy Growth; first paid plan for Chainstack and dRPC |
| Window | 7 days, Nov 5, 2026, 14:06 UTC to Nov 12, 2026, 14:06 UTC |
| Capture time | Nov 12, 2026, 14:06 UTC |
| Probe regions | DE, US, SG |
| Probe cadence | Every 1–3 minutes |
| Probe service | Python service on Vercel serverless functions |
| Methods probed | eth_call, eth_getBalance (archive), eth_getLogs, eth_getTransactionReceipt, debug_traceTransaction, eth_blockNumber, debug_traceBlockByNumber, eth_subscribe |
| Failure rule | Response time above 55 seconds |
| Formula | Score = 1 / ((1/ResponseTime) × (SuccessRate³)), per region, then averaged |
| Compare page | compare.chainstack.com, Arc, 7d |
| Pinned dashboard | Grafana, this window |
| Live dashboard | Grafana, current window |
| Collection code | chainstacklabs/compare-dashboard-functions |
Related reports