AI-ready infrastructure
 Refer and earn


 Ethereum
 Hyperliquid
 Solana
 Arbitrum
 BNB Smart Chain
 Base
 Polygon
 TRON
 Sui
 Robinhood


Solana RPC provider scores for DEX aggregators (November 2026)

Data sources: the Chainstack Compare scorecard and the 7-day dashboard, both read on Nov 10, 2026 (the scorecard shows no timestamp).
Abstract
Chainstack scores 80 out of 100 for Solana DEX aggregators, 3.2 points ahead of Alchemy (77) and 8.3 ahead of Quicknode (72). The score rests on 79% of the scorecard weight. Chainstack leads on Cost and Coverage and trails on Reliability, Limits and RPS, and Support.
Key findings
- Chainstack scores 80, Alchemy 77 and Quicknode 72; the 3.2-point gap between first and second is above the page's 3-point tie threshold.
- Performance, the heaviest pillar for DEX aggregators at 30%, is a three-way tie at 100: mean P95 is 41.5 ms for Chainstack, 47.8 ms for Quicknode and 69.8 ms for Alchemy, all under the 80 ms ceiling.
- Cost is Chainstack's widest lead: $4.87 per 1M requests against $12.74 for Alchemy and $16.64 for Quicknode, a Cost score of 60 against 33 and 34.
- Chainstack does not lead on Reliability: 87 against 100 for Alchemy and Quicknode, from a regional availability mean of 99.982%.
- Alchemy leads Limits and RPS (62 against 49 for Chainstack and 15 for Quicknode) at 408 RPS against 50 RPS on a roughly $50 plan.
- Chainstack has the lowest Support score (12 against 23 and 26).
Verdict and best for
| Rank | Provider | Score | Highest score on this scorecard for |
|---|---|---|---|
| 1 | Chainstack | 80 | Cost (60), Coverage (94) |
| 2 | Alchemy | 77 | Limits and RPS (62), Support (26), Reliability (100, tied) |
| 3 | Quicknode | 72 | Enterprise (93), Reliability (100, tied) |
Performance (100) and AI-readiness (79) are ties across all three providers.
Contents
- How the score is built
- Solana RPC provider scores: pillar table
- Provider summaries
- Solana RPC provider comparison by pillar
- Reliability and Performance from the 7-day dashboard
- Conclusion
- Appendix: weights and rules
- Other RPC providers
How the score is built
The score is the page's weighted mean over eight pillars, using the DEX aggregators weights: Performance 30, Reliability 25, Cost 15, Limits and RPS 15, Coverage 8, Support 3, Enterprise 2 and AI-readiness 2.
What the scorecard scored
- Chainstack publishes the scorecard and is one of the providers compared.
- Cost, Limits and RPS, Coverage, Enterprise, Support and AI-readiness are compiled by hand from public pages. The scorecard says to confirm prices and limits with each provider.
- Limits and RPS is 60% scored. Behavior under a 2x spike needs a load test and is not scored.
- On Nov 10, 2026 the page scored neither Reliability nor Performance. Its total over the six static pillars was 63 for Chainstack, 43 for Quicknode and 53 for Alchemy. Those totals exclude the live pillars and are not used elsewhere in this report.
What this report adds
- Reliability and Performance are computed from the 7-day dashboard window read on the same day, with the page's published formulas.
- Reliability rests on availability alone, which is 40% of the pillar. Freshness and correctness are not scored, so Reliability counts for 10 of its 25 weight points.
- Performance rests on mean P95 latency across three regions and counts in full (30 points).
- The score therefore rests on 79 of 100 weight points: the six static pillars (39 points), Reliability (10) and Performance (30).
- Availability uses the mean of the three regional success rates from the page's measurements endpoint (range Nov 3, 2026–Nov 10, 2026). The dashboard snapshot gives one rate per provider, which would lift Chainstack's Reliability from 87 to 95.
What the dashboard measures
- Three probe regions: Frankfurt, US West and Singapore.
- The first paid plan of each provider.
- No end-user latency and no correctness measurement.
- The dashboard also lists Helius and dRPC on Solana. The scorecard does not score them, so they are left out.
How to read the numbers
- Scores are rounded to whole numbers, so a 1-point difference against the page can come from rounding. A gap under 3 unrounded points is a tie by the page's rule.
- Performance is capped: any mean P95 at or under 80 ms scores 100, so the pillar does not separate providers that are all under that line.
- Behavior under a spike is a load-test metric the page does not score.
Solana RPC provider scores: pillar table
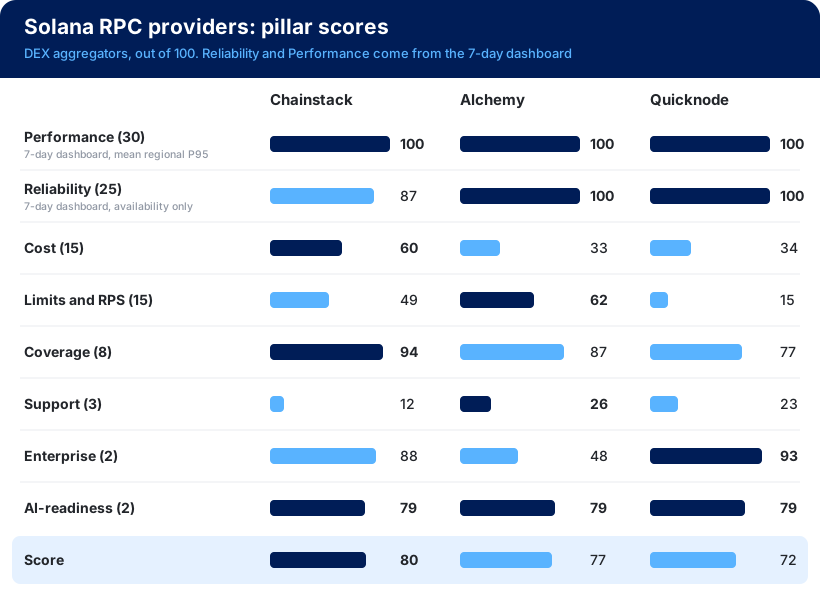
Chainstack scores 80, Alchemy 77 and Quicknode 72. Bold marks the highest score in each row, and ties are bold for every tied provider.
| Pillar (weight) | Chainstack | Quicknode | Alchemy |
|---|---|---|---|
| Performance (30) | 100 | 100 | 100 |
| Reliability (25) | 87 | 100 | 100 |
| Cost (15) | 60 | 34 | 33 |
| Limits and RPS (15) | 49 | 15 | 62 |
| Coverage (8) | 94 | 77 | 87 |
| Support (3) | 12 | 23 | 26 |
| Enterprise (2) | 88 | 93 | 48 |
| AI-readiness (2) | 79 | 79 | 79 |
| Score | 80 | 72 | 77 |
| Rank | 1 | 3 | 2 |
Performance and Reliability are computed from the 7-day dashboard; the other six come from the scorecard.
Provider summaries
- Chainstack, rank 1, score 80. Strongest on Cost ($4.87 per 1M requests) and Coverage (94). Weakest on Support (12), Reliability (87) and RPS on a roughly $50 plan (50 RPS).
- Alchemy, rank 2, score 77. Strongest on Limits and RPS (408 RPS on a roughly $50 plan) and Reliability (100). Weakest on Enterprise (48) and on Cost ($12.74 per 1M requests, score 33), and its mean P95 of 69.8 ms is the highest of the three.
- Quicknode, rank 3, score 72. Strongest on Enterprise (93) and Reliability (100). Weakest on Limits and RPS (15), and its $16.64 per 1M requests is the highest price of the three.
Solana RPC provider comparison by pillar
Each table marks the best value: the highest score, the lowest price. Prices, limits and plan terms are as the scorecard showed them on Nov 10, 2026; confirm them with each provider.
Cost: price per 1M requests (weight 15)
| Metric (share of pillar) | Chainstack | Quicknode | Alchemy |
|---|---|---|---|
| $ per 1M requests, Solana mix, compute only (70%) | $4.87, score 53 (Growth) | $16.64, score 17 (Accelerate) | $12.74, score 25 (Pay As You Go) |
| Bill predictability (20%) | 100 | 100 | 70 |
| Archive per 1M requests (10%) | $10.65, score 30 | $16.64, score 17 | $20.80, score 11 |
The benchmark is 18.69M calls per month.
Limits and RPS: rate limits (weight 15, 60% scored)
| Metric (share of pillar) | Chainstack | Quicknode | Alchemy |
|---|---|---|---|
| RPS on a roughly $50 plan (40%) | 50 RPS, score 23 (Growth $49) | 50 RPS, score 23 (Build $49) | 408 RPS, score 93 (PAYG) |
| Behavior under spike (40%) | not scored | not scored | not scored |
| Flat-fee or unlimited RPS (20%) | 100: Unlimited Node, 25–500 RPS from $149/mo | 0 | 0 |
Coverage: chains, archive and gRPC (weight 8)
| Metric (share of pillar) | Chainstack | Quicknode | Alchemy |
|---|---|---|---|
| Listed chain count (30%) | 98 (93 listed protocols) | 91 (77 chains) | 90 (75 mainnets) |
| Archive, WebSocket, gRPC, testnets (10% each) | 100 each | 100 each | 100 each |
| Dedicated nodes (10%) | 100: self-serve from Pro, from $0.50/h | 50: Enterprise only | 50: sales only |
| Region selection (10%) | 100 | 50 | 50 |
| MEV protection or private transactions (10%) | 50: Warp at $0.15 per transaction speeds up sendTransaction, not front-running protection | 0 | 100 |
Enterprise (weight 2)
| Metric (share of pillar) | Chainstack | Quicknode | Alchemy |
|---|---|---|---|
| SOC 2 Type II (25%) | 100 | 100 | 100 |
| ISO 27001 (10%) | 100 (Jul 2026) | 100 | 0 |
| SLA of 99.9% or more with credits (25%) | 100: 99.9% | 100: 99.99%, Enterprise only | 0: percentage not disclosed |
| SSO, RBAC and audit log (15%) | 67: audit log not documented | 100 | 100 |
| Single-tenant and jurisdiction (15%) | 50 | 50 | 50 |
| Status page with 90 days of history (10%) | 100 | 100 | 0 |
Support (weight 3)
| Metric (share of pillar) | Chainstack | Quicknode | Alchemy |
|---|---|---|---|
| Response time, roughly $50 plan (50%) | 0: under 24 h, 24×5, 72 h worst case | 18: 24-hour SLA | 18: 24 h |
| Response time, roughly $500 plan (30%) | 0: under 24 h, 24×5 | 46: 8-hour SLA | 18 |
| Channels and coverage (20%) | 60 | 0 | 60 |
AI-readiness (weight 2)
| Metric (share of pillar) | Chainstack | Quicknode | Alchemy |
|---|---|---|---|
| MCP, 5 reference tasks (35%) | 80: 4 of 5 | 40: 2 of 5 | 40: 2 of 5 |
| Docs for LLMs (25%) and machine-readable pricing (15%) | 100 each | 100 each | 100 each |
| Skills or plugins (10%) | 50 | 100 | 100 |
| Agent self-serve and payments (15%) | 40 | 100 | 100 |
Reliability and Performance from the 7-day dashboard
The window is 7 days. No flag was set, and each provider's P95 equals its three-region mean.
Performance: P95 latency (weight 30)
| Provider | Frankfurt P95 | US West P95 | Singapore P95 | Mean P95 | Score |
|---|---|---|---|---|---|
| Chainstack | 29.4 ms | 54.4 ms | 40.7 ms | 41.5 ms | 100 |
| Quicknode | 26.0 ms | 53.3 ms | 64.1 ms | 47.8 ms | 100 |
| Alchemy | 24.6 ms | 38.3 ms | 146.7 ms | 69.8 ms | 100 |
Lower is better. Alchemy's Singapore P95 of 146.7 ms is the widest regional gap, yet its mean stays under the 80 ms ceiling.
Reliability: availability (weight 25, 40% scored)
| Provider | Frankfurt | US West | Singapore | Mean availability | Score |
|---|---|---|---|---|---|
| Chainstack | 99.945% | 100% | 100% | 99.982% | 87 |
| Quicknode | 100% | 99.990% | 99.990% | 99.993% | 100 |
| Alchemy | 100% | 100% | 100% | 100% | 100 |
Higher is better. Availability is request success, not time-based uptime. The score is 100 at 99.99% or above and falls to 0 at 99%.
Conclusion
Chainstack has the highest score for Solana DEX aggregators on this scorecard: 80, 3.2 points ahead of Alchemy (77), with Quicknode at 72. The score rests on 79% of the weight, and the gap to second place is small enough that a different weighting changes the order.
- Cost: Chainstack, 60, at $4.87 per 1M requests.
- Coverage: Chainstack, 94.
- Limits and RPS: Alchemy, 62, at 408 RPS on a roughly $50 plan.
- Reliability: Alchemy and Quicknode tie at 100; Chainstack is at 87.
- Support: Alchemy, 26; Chainstack is lowest at 12.
- Enterprise: Quicknode, 93.
- Performance and AI-readiness: ties.
Appendix: weights and rules
| Pillar | Weight for DEX aggregators | Scored share |
|---|---|---|
| Performance | 30 | 100% (computed) |
| Reliability | 25 | 40% (computed, availability only) |
| Cost | 15 | 100% |
| Limits and RPS | 15 | 60% |
| Coverage | 8 | 100% |
| Support | 3 | 100% |
| Enterprise | 2 | 100% |
| AI-readiness | 2 | 100% |
Performance is 100 at a mean P95 of 80 ms or less, 0 at 1,500 ms or more, and otherwise 100 × ln(1500 / m) / ln(1500 / 80). Reliability is 100 at 99.99% availability or more, 0 at 99% or less, and otherwise 50 × (−log10(1 − a) − 2). The score is the sum of weight × scored share × pillar score, divided by the sum of weight × scored share.
Other RPC providers
The scorecard scores only the providers in this report. These Chainstack lists cover others.