AI-ready infrastructure
 Refer and earn


 Ethereum
 Hyperliquid
 Solana
 Arbitrum
 BNB Smart Chain
 Base
Base Polygon
 TRON
TRON Sui
Sui Robinhood


How to measure RPC latency: P50, P95, P99 explained

A methodology guide for benchmarking RPC providers across regions — with real Arbitrum data, common measurement mistakes, and how to read latency dashboards for production decisions.
TL;DR
Most public RPC benchmarks cite average latency. That’s the wrong metric for production workloads. Average hides tail latency — the 1-in-100 requests that determine whether your trading bot fires, your wallet feels snappy, or your indexer keeps up with block production.
This guide covers the metrics that actually matter (P50, P95, P99, success rate), how to measure them yourself, and how to read a live latency dashboard properly. We’ll use current Arbitrum benchmarks as the case study — where Chainstack currently ranks #1 with 266ms P95 at 100% availability across three regions.
By the end, you’ll know what “good” latency looks like for your chain, what a P99 spike really tells you about a provider’s infrastructure, and why success rate matters more than everyone gives it credit for.
Why RPC latency matters
Every RPC call sits on your app’s critical path. When latency degrades, the impact isn’t linear:
- Trading bots miss inclusion windows. On Arbitrum’s 250ms block time, a 500ms round-trip delay pushes you into the next block — sometimes past the arbitrage opportunity entirely.
- Wallet UX feels broken. Users perceive delays above 400ms as sluggish; above 1 second as unresponsive.
- MEV searchers lose bundle placement. Sub-100ms consistency is table stakes for competitive bundle submission.
- Real-time dashboards stall. WebSocket subscription lag creates data staleness that compounds across UIs.
- Indexers fall behind. If your indexer can’t process blocks faster than they’re produced, you accumulate a backlog that never recovers without infrastructure changes.
The question isn’t whether latency matters — it’s which latency metric matters for your workload. That’s where most benchmarks fail.
Latency metrics that actually matter
P50 (median) — the typical experience
P50 tells you what half your users see. If P50 is 200ms, half of all requests finish faster than that, half take longer. It’s the closest single number to “how does it feel on average” — but it’s still incomplete, because half your users have worse experiences than P50 suggests.
Use P50 for baseline expectations. Never use it alone.
P95 — the reliability threshold
P95 tells you what your worst 5% of users see. If P95 is 400ms, 95% of requests finish faster than 400ms, but 5% take longer. For most production apps, P95 is the most important number: it captures the consistency of the infrastructure, not just its best-case performance.
A provider with 100ms P50 and 200ms P95 is dramatically more reliable than one with 100ms P50 and 800ms P95 — even though their “average” might look identical.
P99 — the tail latency threshold
P99 tells you what your worst 1% of requests look like. For most apps, P99 is diagnostic — a signal about how well the provider handles edge cases (cold caches, node restarts, network hiccups, regional failovers).
For trading and MEV workloads, P99 is critical. If you fire 100 trades a day, 1 of them will hit the P99 latency. A 3-second P99 means one trade a day arrives 3 seconds late.
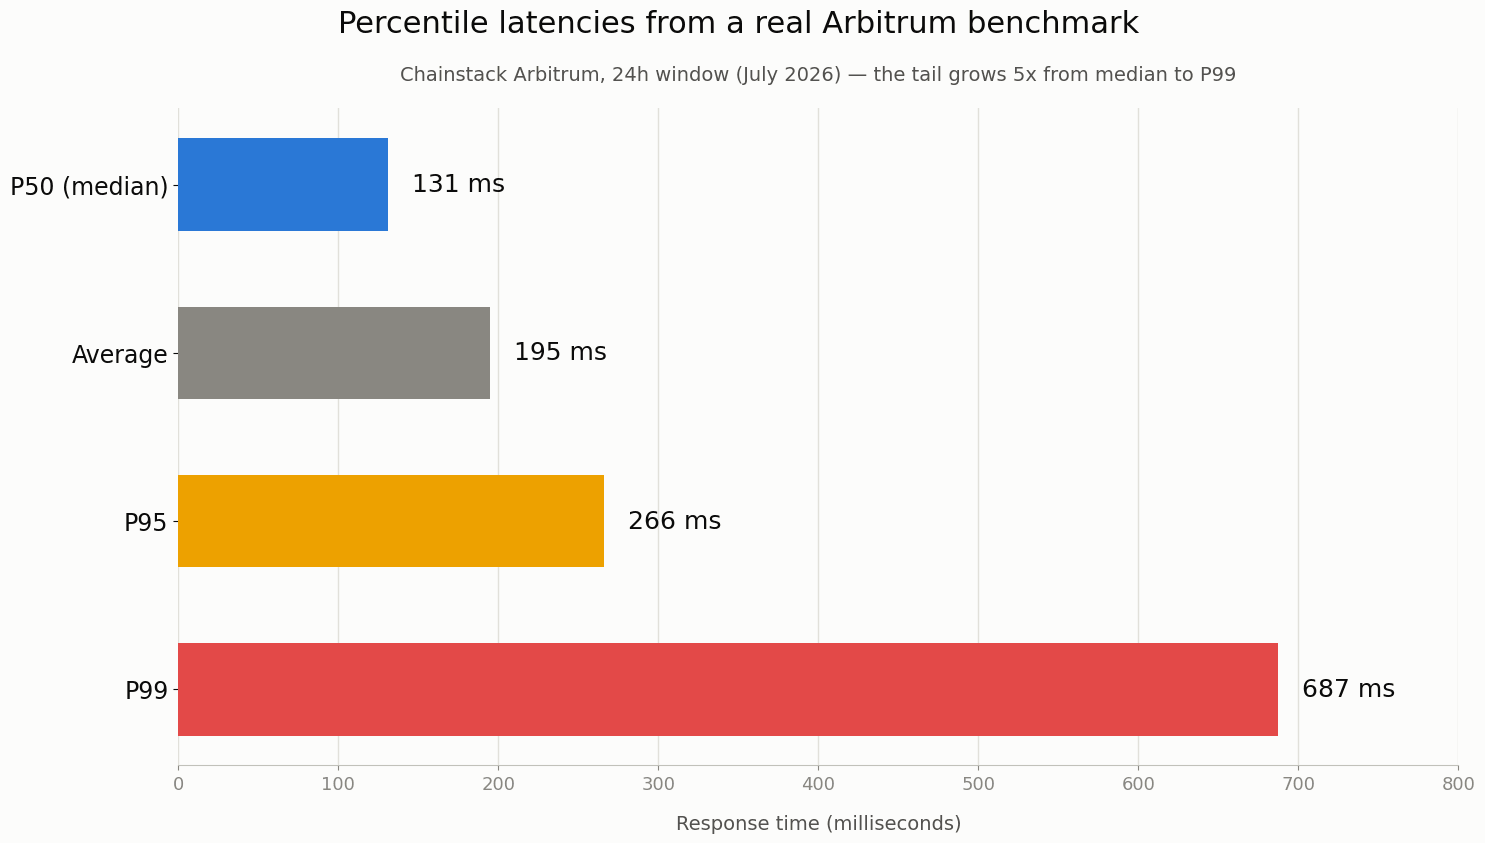
Why P99 matters in practice:
Consider a provider showing P95 of 300ms and P99 of 700ms. The P95 looks competitive. But that P99 tells you 1 in 100 requests takes over 700ms. For a trading bot firing 10,000 requests a day, that’s 100 requests hitting the slow path — potentially the difference between landing an arbitrage and missing it. Ratios of P99 to P95 above 2x usually indicate infrastructure inconsistency worth investigating: cold caches, regional failovers, or capacity pressure showing up in the tail.
Why average is misleading
The single biggest measurement mistake in RPC benchmarking is citing averages instead of percentiles. Averages get pulled around by outliers in ways percentiles don’t.
A provider with two very fast regions and one very slow region can post a great “average” that no user in the slow region will ever experience. Averages also fail to capture the shape of the distribution — one 5-second request in a batch of 1,000 barely moves the average but dominates P99.
Rule of thumb: if a benchmark only gives you an average, it’s marketing, not measurement.
Success rate: the metric everyone underweights
Here’s an underrated fact: 99.99% availability delivers roughly 7x fewer failures than 99.93%.
That gap looks small in percentage terms — 0.06 percentage points. In practice, it’s the difference between one failed request in ten thousand versus seven failed requests in ten thousand. For a trading bot firing 100k requests a day, that’s the difference between 10 failures and 70.
The Chainstack Compare methodology uses this specific scoring formula:
Score = 1 ÷ ((1/ResponseTime) × (SuccessRate³))
Success rate is cubed. That’s not arbitrary — it’s a deliberate choice to penalize even small reliability drops heavily. Cubing means a provider with 99% success gets 3x the penalty compared to 99.7%, not a linear 0.7% penalty.
The reasoning: production apps care about consistent reliability more than average reliability. A provider that’s fast on good days but drops requests on bad days is worse than a slightly slower provider that never drops.
How to measure RPC latency yourself
If you’re evaluating a provider, don’t rely on their marketing benchmarks. Run your own. Here’s what a rigorous test setup looks like.
Test setup
Geographic distribution: Test from at least three regions. RPC latency is dominated by physical network distance for most workloads — a US-East endpoint tested only from US-East hides how your Asian users will actually experience the service.
Minimum recommended regions: North America, Europe, Asia-Pacific. If you have specific geographic user concentrations, add matching test regions.
Sample size: Aim for at least 10,000 requests per region over 24+ hours. Anything less gives you noise; anything less than a full day misses time-of-day variation. Providers behave differently at 3am UTC versus 8pm UTC.
Method selection: Different RPC methods have very different latency profiles. A good benchmark tests a mix:
- Light methods:
eth_blockNumber,eth_chainId— pure state reads, minimal computation - Medium methods:
eth_call,eth_getBalance— some computation, cache-friendly - Heavy methods:
eth_getLogs,debug_traceTransaction— expensive, cache-unfriendly
Testing only eth_blockNumber will make every provider look fast. Testing only eth_getLogs on wide block ranges will show real infrastructure differences.
Warmup period
The first N requests to any endpoint are typically slower than subsequent ones — DNS resolution, TLS handshakes, connection pooling, and provider-side caching all warm up over time. Discard the first ~100 requests from your dataset, or run a warmup phase before the measured phase.
Timeout handling
Set a realistic timeout. Chainstack Compare uses 55 seconds as its ceiling. Anything faster than 30 seconds risks classifying legitimate slow requests as failures; anything slower than 60 seconds gives no useful signal for production apps.
Failure counting
Count these as failures:
- Timeouts
- HTTP non-200 responses
- JSON-RPC error responses (per the spec)
- Excessive block delays (for methods returning block data)
Do not exclude failures from your latency dataset — they’re the most important signal. A provider with fast successful responses but frequent failures is worse than one with slightly slower but reliable responses.
Benchmark script
Here’s a minimal Python benchmark that captures the key metrics:
import time
import requests
from statistics import quantiles

RPC_URL = "https://your-rpc-endpoint.com"
SAMPLE_SIZE = 10000
WARMUP = 100
TIMEOUT = 55

payload = {
    "jsonrpc": "2.0",
    "method": "eth_blockNumber",
    "params": [],
    "id": 1
}

# Warmup
for _ in range(WARMUP):
    try:
        requests.post(RPC_URL, json=payload, timeout=TIMEOUT)
    except Exception:
        pass

# Measure
latencies = []
failures = 0

for _ in range(SAMPLE_SIZE):
    start = time.time()
    try:
        r = requests.post(RPC_URL, json=payload, timeout=TIMEOUT)
        if r.status_code == 200 and "error" not in r.json():
            latencies.append((time.time() - start) * 1000)
        else:
            failures += 1
    except Exception:
        failures += 1

# Report
success_rate = len(latencies) / SAMPLE_SIZE * 100
p50, p95, p99 = quantiles(latencies, n=100)[49], quantiles(latencies, n=100)[94], quantiles(latencies, n=100)[98]

print(f"Success rate: {success_rate:.2f}%")
print(f"P50: {p50:.0f}ms | P95: {p95:.0f}ms | P99: {p99:.0f}ms")
Run this from three regions, combine the results, and you have a real benchmark. Run it against multiple providers with the same script — and you can make an informed decision.
Common measurement mistakes
Every team that benchmarks providers themselves makes at least one of these mistakes. Avoid them.
| Mistake | Why it hurts | Fix |
|---|---|---|
| Testing only from one region | Latency dominated by network distance — single-region tests miss geographic reality | Test from US, EU, APAC minimum |
| Off-peak testing only | Infrastructure behaves differently at 3am UTC vs market open | Include peak and off-peak windows |
| Not distinguishing hot vs cold | First request slower due to connection setup, cache warmup | Discard first 100 requests |
| Method complexity ignored | eth_blockNumber returns in ms, debug_traceTransaction can take seconds | Test light + medium + heavy method mix |
| Skipping warmup phase | Connection setup skews P95/P99 | Discard first ~100 requests |
| Failures counted as non-events | Provider with 100ms P95 + 2% failure rate worse than 200ms P95 + 100% success | Include failures in latency dataset |
Chain-specific latency considerations
Not all chains have the same latency profile. What counts as “good” latency depends on the chain and your workload.
 Ethereum
Methods are relatively homogeneous. Most read operations complete in similar time ranges — eth_blockNumber, eth_getBalance, eth_call all cluster within a narrow band. The main variance comes from archive queries and debug_* / trace_* methods, which can be 10-50x slower than standard reads. Ethereum’s 12-second block time also means block propagation lag is less critical than on faster chains — a 500ms RPC response is still comfortably within block time.
Good P95 for L1: under 500ms is competitive; under 300ms is excellent.
 Solana
sendTransaction and getSlot have radically different profiles. sendTransaction involves cluster propagation and validator gossip — it can take 400ms+ under normal conditions and 2s+ during congestion. getSlot returns in tens of milliseconds. Benchmarking one and reporting it as the provider’s “latency” is meaningless.
More importantly, for Solana trading workloads the real metric is transaction landing rate — the percentage of submitted transactions that actually make it into a block. A provider with fast sendTransaction responses but 60% landing rate is useless. Chainstack Compare tracks landing rate separately for exactly this reason, using standardized memo transactions with fixed priority fees.
Good P95 for Solana reads: under 200ms. Landing rate: above 90% for production trading.
L2s (Arbitrum, Base, Optimism)
L2 latency stacks in three layers: RPC round-trip + sequencer soft finality (~2s) + Ethereum hard finality (~7 days for withdrawals). For most application logic, RPC latency dominates the user experience because sequencer confirmation happens automatically in the background.
Arbitrum specifically has one wrinkle: pre-Nitro blocks (before block #22,207,815) require arbtrace_* methods instead of standard debug_*. If your analytics or forensic tool benchmarks the wrong namespace, you’ll see either failures or artificial slowness. Base and Optimism share the OP Stack namespace behavior, so provider coverage transfers between them.
Good P95 for L2s: under 350ms is competitive; under 300ms is excellent.
 Hyperliquid
Perp trading requires sub-100ms consistency. Order book updates and HyperCore precompile reads have distinct latency budgets that standard RPC benchmarking doesn’t fully capture. WebSocket subscription lag matters more than HTTP request/response — a bot polling order book state via HTTP will always lose to one subscribing via WebSocket, regardless of provider P95.
For Hyperliquid trading infrastructure, benchmark WebSocket subscription latency (time from block/order production to WS delivery) separately from HTTP RPC.
Good P95 for Hyperliquid HTTP RPC: under 150ms. WebSocket delivery lag: under 100ms for trading workloads.
Chainstack Compare: transparent open-source benchmarks
The problem with most RPC provider benchmarks is that they’re published by the providers themselves. “We’re the fastest” without measurable, verifiable data is marketing, not evidence.
Chainstack Compare takes a different approach: real-time latency and success rate measurements across providers, published continuously in two forms.
- Landing page (compare.chainstack.com) — quick per-chain rankings with P50/P95/P99 and per-region breakdowns. Refreshes every 3 minutes.
- Public Grafana dashboards — per-method deep-dive with 14 days of history. Filter by method, provider, region, time window. No login required. Example: Ethereum performance dashboard.
How it actually works
The methodology matters. Here’s what the dashboard actually does:
- Data collection: Vercel serverless functions in three regions (US, Germany, Singapore) fire real RPC requests every 1-3 minutes
- Method coverage: commonly used methods per chain — balance checks, transaction simulation, block queries
- Failure classification: timeouts >55s, non-200 responses, JSON-RPC errors all count as failures
- Ranking formula:
Score = 1 ÷ ((1/ResponseTime) × (SuccessRate³))— cubed success rate penalizes reliability drops disproportionately - Open source: the entire data collection service is published on GitHub. Fork it, verify the methodology, run your own copy
For the launch details and full architecture breakdown, see the Chainstack Compare Dashboard launch post and the Arbitrum + BNB expansion update.
Case study: reading Arbitrum latency benchmarks
Let’s apply everything above to a real snapshot. Here’s the current Arbitrum ranking on compare.chainstack.com, as of July 2026, 24-hour window:
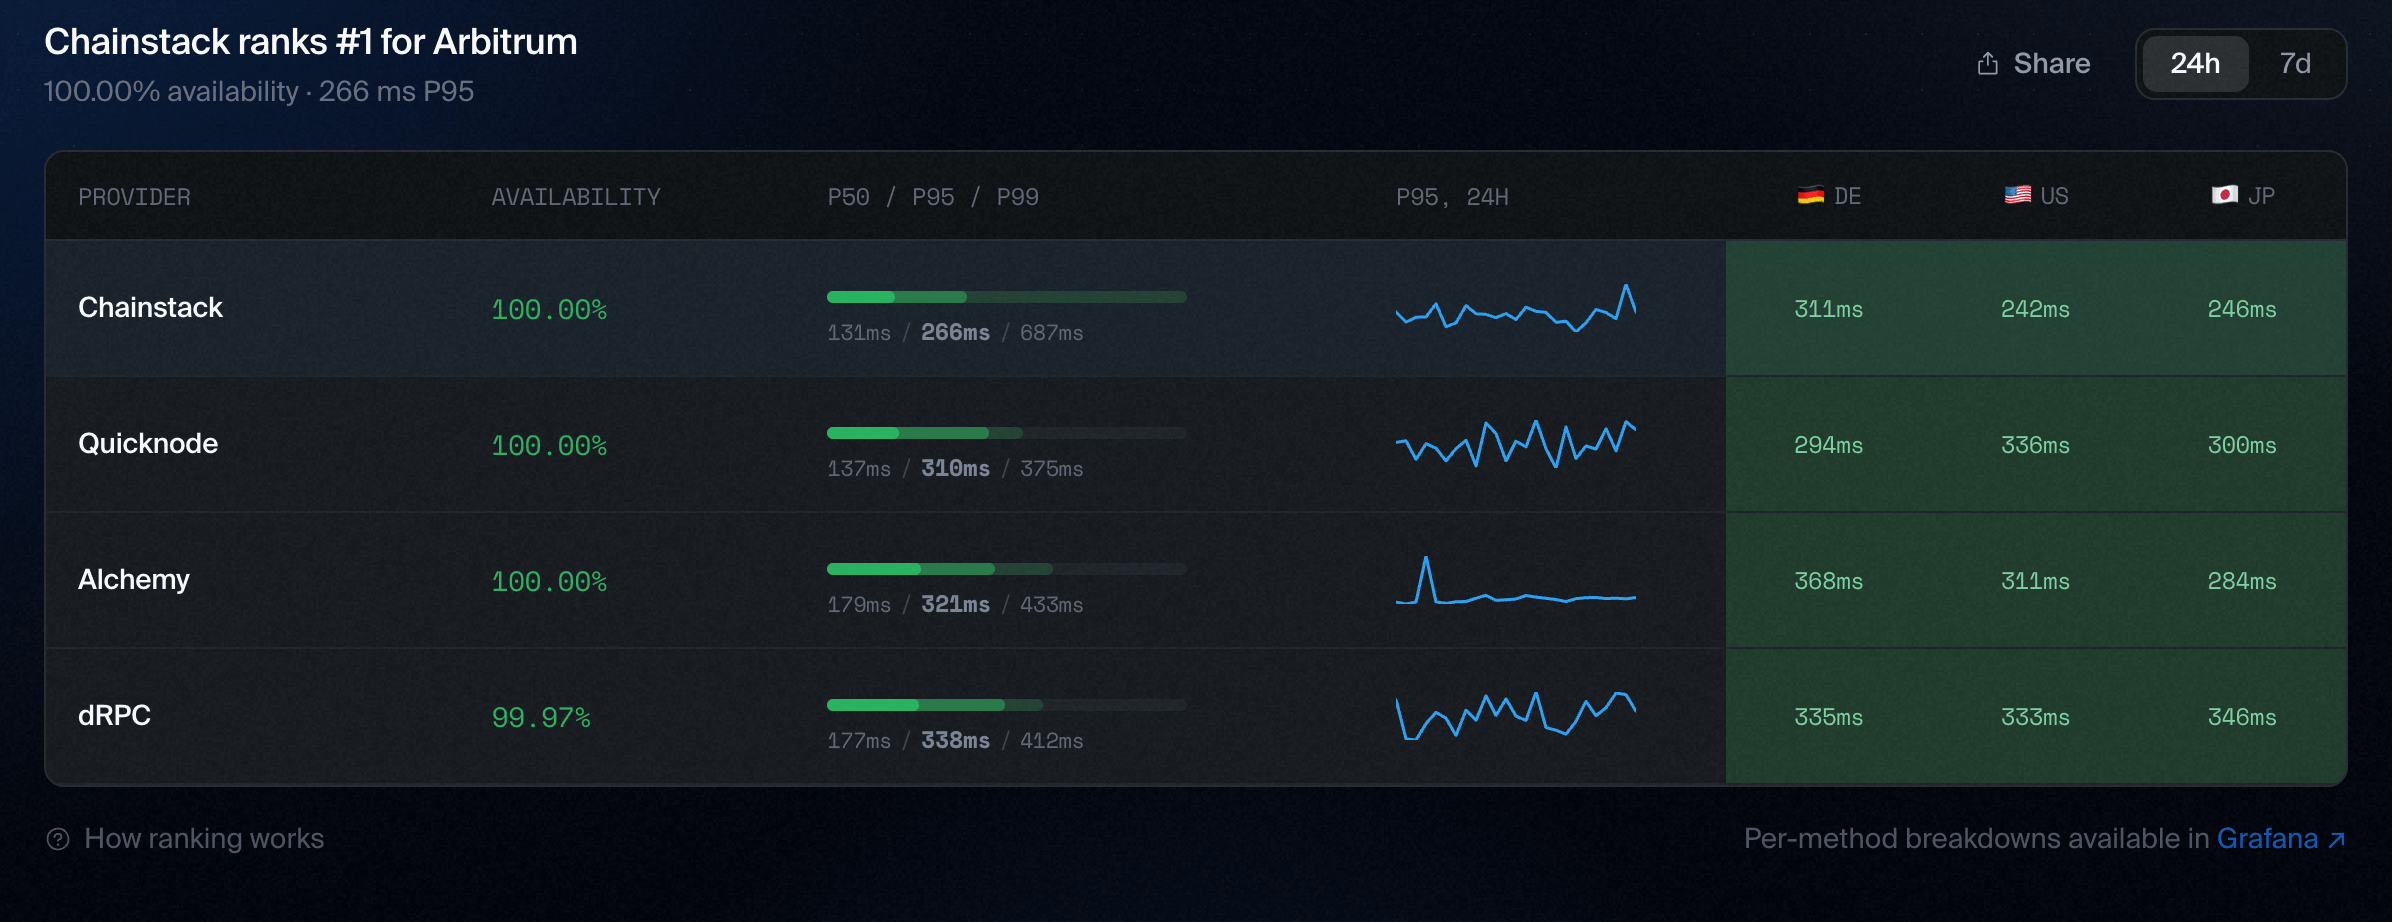
Chainstack ranks #1 with 100% availability and 266ms P95. Four things worth unpacking here.
Speed advantage against tied availability
Three of the four providers post 100% availability. Only dRPC drops the top tier at 99.97% — a small gap that translates to roughly three failed requests per ten thousand versus zero. Not catastrophic for most workloads, but meaningful for high-frequency trading and MEV where every request counts.
With availability tied at the top, P95 is the differentiator. Chainstack’s 266ms beats Quicknode’s 310ms by 14% and Alchemy’s 321ms by 17%. On Arbitrum’s 250ms block time, that difference determines whether your submitted transaction lands in the current block or slips to the next.
The takeaway: when top providers converge on high availability, speed becomes the ranking factor. Chainstack Compare’s scoring formula picks up this shift automatically — reliability is cubed, but with reliability effectively equal across the top three, the response time factor dominates.
Regional performance: where each provider actually wins
Aggregate P95 hides regional variance. The regional columns reveal specific strengths:
- US (US-East test region): Chainstack 242ms — the fastest single-region number across all providers. If your users concentrate on the US East coast, this is a decisive advantage.
- Japan (APAC test region): Chainstack 246ms — again the fastest, dominating APAC latency for the group. Trading platforms serving Asian markets pay lower round-trip costs.
- Germany (EU test region): Quicknode 294ms takes this region, edging Chainstack’s 311ms by 17ms. Chainstack does not win everywhere — Quicknode’s European infrastructure is competitive here.
Every provider has a regional profile. Chainstack wins US and JP by comfortable margins; Quicknode wins DE narrowly. Alchemy’s regional numbers cluster around 284-368ms — no strong region, no weak region. dRPC lags in every region.
For a production app with global users, this means multi-region provider evaluation isn’t optional. Aggregate rankings tell you the headline; regional data tells you whether the provider fits your geography.
The P99 story worth watching
There’s honest tension in the data. Chainstack has the fastest P50 (131ms) and P95 (266ms) in the group — but the highest P99 (687ms) among the top three.
The P95-to-P99 ratios:
- Chainstack: 266ms → 687ms (2.58x)
- Quicknode: 310ms → 375ms (1.21x)
- Alchemy: 321ms → 433ms (1.35x)
- dRPC: 338ms → 412ms (1.22x)
Chainstack has the largest tail spread in the top three. Interpretation: the infrastructure is optimized for typical-case speed, and 95% of requests are fast — but the worst 1% see wider variance than the more consistent (and slower on average) alternatives.
For most production workloads this is a favorable trade-off: your median user gets substantially faster responses, and the tail impact is bounded. For latency-sensitive trading at the P99 level specifically, it’s worth monitoring — the Grafana per-method breakdowns show whether the P99 spikes concentrate in specific methods or time windows.
This is exactly the kind of nuance that headline “we’re the fastest” marketing hides — and exactly why publishing real numbers matters more than publishing claims.
Deeper dive via Grafana
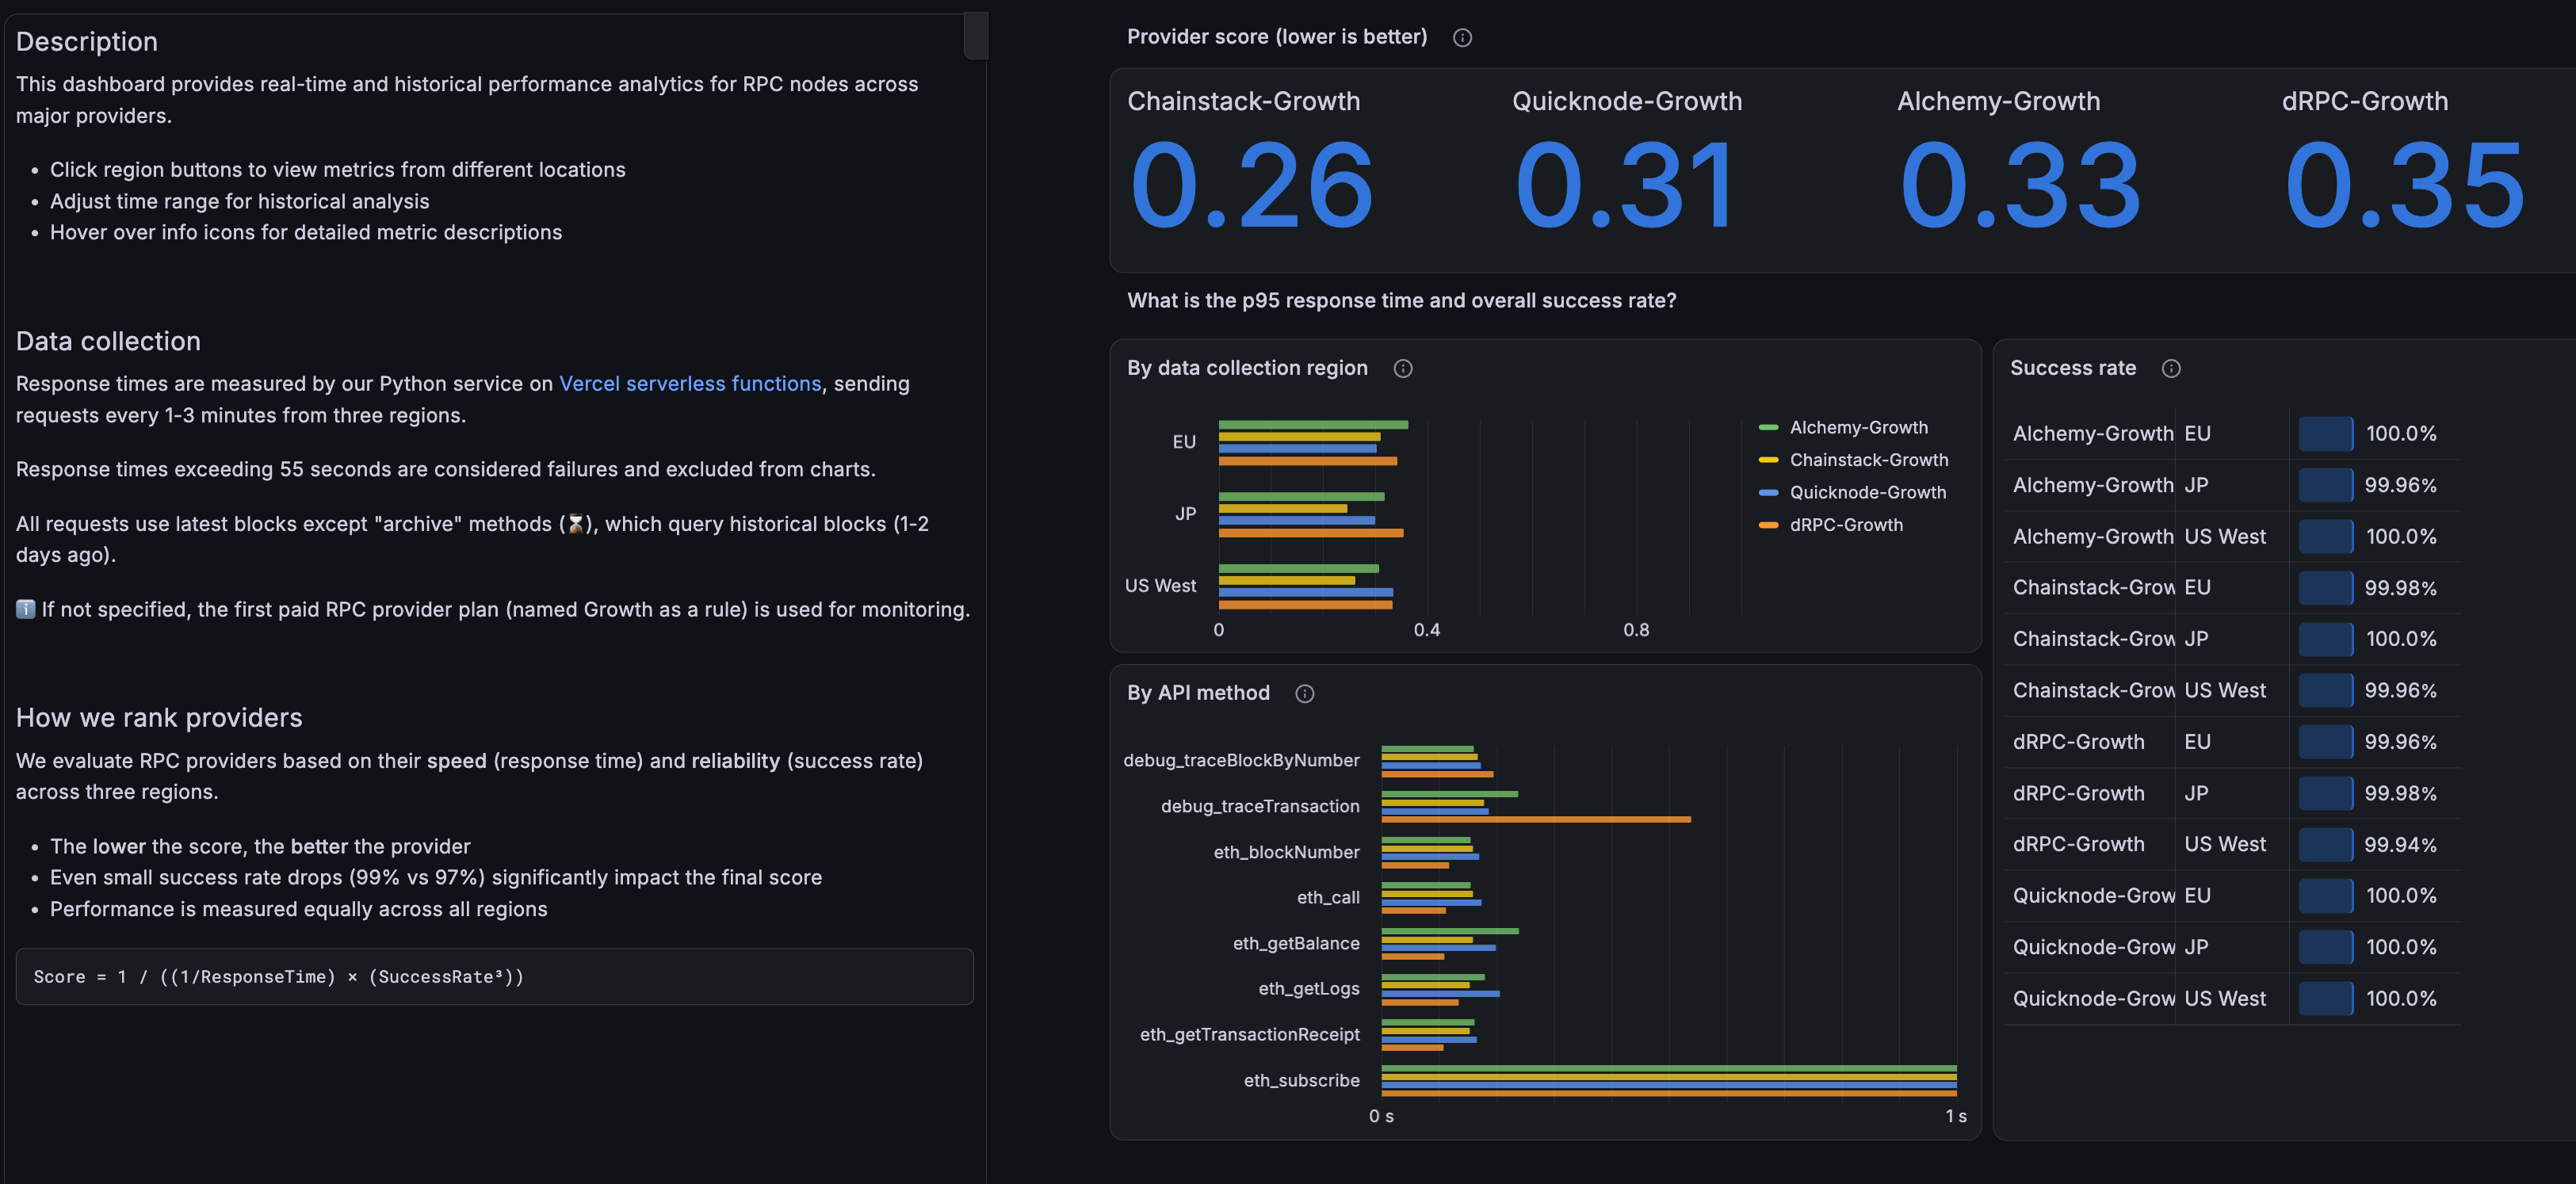
For per-method breakdowns on Arbitrum, open the Arbitrum Grafana dashboard. It shows:
- eth_call vs eth_getBalance vs eth_getLogs — different latency profiles per method
- 7-day and 14-day historical charts — how rankings shift over time
- Success rate breakdown by method + region — where failures actually happen
Aggregate rankings tell you the headline. Per-method data tells you whether the provider fits your workload.
When RPC latency doesn’t matter
Not every workload cares about latency. If you’re building any of these, optimize for cost over speed:
- Batch indexers — retry-tolerant, throughput matters more than per-request latency
- Historical analytics — running trace queries over past blocks doesn’t need real-time response
- Backfill jobs — bulk data ingestion that runs asynchronously
- Tax reporting — long-range historical queries where seconds don’t matter
- Research pipelines — one-off queries for ad-hoc analysis
For these, a provider with 500ms P95 and predictable request-based pricing beats one with 100ms P95 and credit-multiplier billing.
When RPC latency is critical
For these workloads, latency variance directly impacts your business:
- Trading bots — inclusion probability depends on submission timing
- MEV searchers — bundle placement is millisecond-competitive
- Wallet UX — user perception of “fast” starts breaking above 400ms
- Real-time dashboards — data staleness compounds across the UI
- Live liquidation engines — the difference between profit and loss is often single-digit milliseconds
- Cross-chain bridges — settlement timing sensitive to source-chain finality signals
For these, invest in dedicated infrastructure, test benchmarks yourself, and prioritize P99 consistency over P50 headline numbers.
Conclusion
Measuring RPC latency well isn’t complicated, but it does require discipline. Test from multiple regions. Test with a mix of methods. Look at P95 and P99, not averages. Weight success rate seriously. Discard warmup. Count failures.
Most importantly: verify claims independently. If a provider can’t show you live, per-method, per-region latency data with an auditable methodology, treat their performance claims as marketing.
The Chainstack Compare dashboard exists to change that dynamic — real-time measurements, open-source methodology, public Grafana dashboards, 14 days of history. It’s the same infrastructure Chainstack itself is measured against every three minutes, published live for anyone to audit.
FAQ
Rough production targets in 2026:
– Ethereum L1: P95 under 500ms is competitive; under 300ms is excellent
– Solana: measure transaction landing rate over standard P95 — targets vary by workload
– L2s (Arbitrum, Base, Optimism): P95 under 350ms is competitive; under 300ms is excellent
– Hyperliquid: P95 under 100ms for perp trading workloads
Continuously if you’re latency-sensitive. Monthly at minimum for production apps. Providers can degrade or improve over time — infrastructure changes, regional migrations, and capacity shifts all affect performance.
Both, separately. HTTP request/response latency and WebSocket subscription lag have different profiles and different failure modes. If your app depends on eth_subscribe for pending transactions, HTTP benchmarks tell you nothing about that dimension.
Rarely. Provider-published benchmarks tend to select methodology that favors their infrastructure — cherry-picking regions, methods, or time windows. Cross-reference with independent measurements, run your own tests, or use a publicly-auditable dashboard like Chainstack Compare.
The Chainstack Compare Grafana dashboards are public and show per-method latency, per-region breakdowns, and 14-day historical charts for every tracked chain.
Yes — the dashboard documentation notes that all providers are tested on their paid tiers (except TonCenter, which uses the free tier as they don’t have a paid one). The results reflect production infrastructure, not free-tier performance.
WebSocket lag is a different measurement than HTTP round-trip. Subscribe to newHeads (or the chain equivalent) on the provider’s WebSocket endpoint, then measure the delta between block production timestamp (from the block header) and the moment your subscription receives it. Run this for hours across multiple regions to build a distribution. Providers with stable WebSocket infrastructure typically deliver blocks within 100-300ms of production on Ethereum; slower deliveries usually indicate regional routing issues or subscription server load. For pending transaction subscriptions (newPendingTransactions), measure delivery latency the same way but expect wider distributions — mempool broadcasting is noisier than block propagation.
The first request to any endpoint carries connection setup overhead: DNS resolution, TCP handshake, TLS negotiation, and often provider-side cache warmup. This can add 100-500ms to the first request. Subsequent requests on the same connection reuse the setup, so they’re measurably faster. If your app uses short-lived connections (each request is a new HTTPS session), you’re paying this cost every time — consider connection pooling or persistent HTTP/2 clients. Benchmarks should either warm up with 50-100 discarded requests, or explicitly separate cold-start latency from steady-state latency in reporting.
For P99 to be statistically meaningful, you need at least 1,000 samples — that gives you 10 requests in the 99th percentile bucket. For P99.9 (which some trading workloads care about), you need at least 10,000 samples. Below these thresholds, your P99 is dominated by whichever unlucky outlier landed in the small sample. This is why serious benchmarks run for 24+ hours across multiple regions: you need enough samples per region to make regional P99 meaningful, not just aggregate.
Yes, and it matters. Some providers use anycast routing that automatically directs your requests to the geographically nearest data center. Others use fixed regional endpoints where you pick a URL like us-east.example.com. Anycast providers can appear faster in benchmarks because your test client’s IP determines routing — a test from Frankfurt hits EU infrastructure, a test from Singapore hits APAC. Fixed-endpoint providers force you to choose, and if you pick wrong, your users pay the latency cost. When benchmarking, check whether the endpoint auto-routes or requires manual region selection — it changes what the numbers actually mean for your production traffic.
Both, and separately. Sequential benchmarks (one request at a time) measure baseline latency — the theoretical best case. Concurrent benchmarks (many requests in parallel) measure how the provider’s infrastructure handles load — which is closer to production behavior. A provider that looks fast in sequential tests can degrade significantly under concurrent load if their rate limiting, connection pooling, or backend scaling isn’t well-tuned. Test both patterns: 1,000 sequential requests for baseline, then 100 requests at 10 concurrent connections for load behavior.
Additional resources
Chainstack Compare
- Chainstack Compare landing page
- Chainstack Compare documentation
- Arbitrum performance dashboard (Grafana)
- Open-source data collection repo (GitHub)
- Compare Dashboard launch announcement
- Arbitrum and BNB Chain expansion
RPC provider comparisons