Ethereum
 Solana
 Hyperliquid
 Arbitrum
 Base
Base BNB Smart Chain
 Tempo
Tempo Avalanche
 Aptos
Aptos TRON
TRON Ronin
Ronin zkSync Era
 Optimism
 Sonic
Sonic Polygon
 Unichain
 Fantom
 Gnosis Chain
 Sui
Sui Avalanche Subnets
 Polygon CDK
 Starknet Appchains
 zkSync Hyperchains


Blockchain RPC Benchmark: Meet Chainbench
Introduction
In Web3 development, every millisecond matters. Slow or unreliable RPC endpoints can quickly become bottlenecks that degrade user experience. Whether you’re syncing blocks, querying smart contracts, or processing transactions, your infrastructure’s performance directly impacts your users. That’s why having a reliable blockchain RPC benchmark is essential to identify weak points early.
But here’s the challenge: how do you know if your RPC endpoint is actually fast? Marketing promises of “10,000 RPS” or “no rate limits” sound impressive, but they don’t tell you what matters most—how your endpoint performs under real-world conditions with the traffic patterns your app generates.
This is why we built Chainbench: an open-source, vendor-neutral tool that provides standardized benchmarking for blockchain RPC infrastructure.
Why blockchain infrastructure needs a benchmark standard
Until now, measuring blockchain node performance has been inconsistent at best. Teams rely on ad-hoc scripts or trust provider claims that are hard to verify. This creates several problems:
- Unrealistic marketing claims: “No rate limits” means little when a single balance query takes 15 seconds during network congestion.
- Inconsistent testing: Without a common tool, it’s nearly impossible to compare providers on equal footing. One-off scripts lack consistency and rarely match real traffic patterns.
- No visibility under load: Endpoints may perform well in testing but fail when traffic spikes. You need to see how they behave under stress.
| Aspect | Ad-hoc Scripts | Chainbench |
|---|---|---|
| Setup time | Hours to days | 5 minutes |
| Test consistency | Varies per script | Standardized profiles |
| Method coverage | Usually 1-3 methods | 20+ methods per profile |
| Traffic realism | Static patterns | Dynamic, weighted distribution |
| Results format | Custom/inconsistent | HTML reports + CSV |
| Provider comparison | Nearly impossible | Direct comparison |
| Reproducibility | Low | High |
| Community support | None | Open-source, documented |
The blockchain space needs what other infrastructure sectors already have: a standardized, transparent way to measure and compare performance. That’s exactly what Chainbench provides.
What is Chainbench
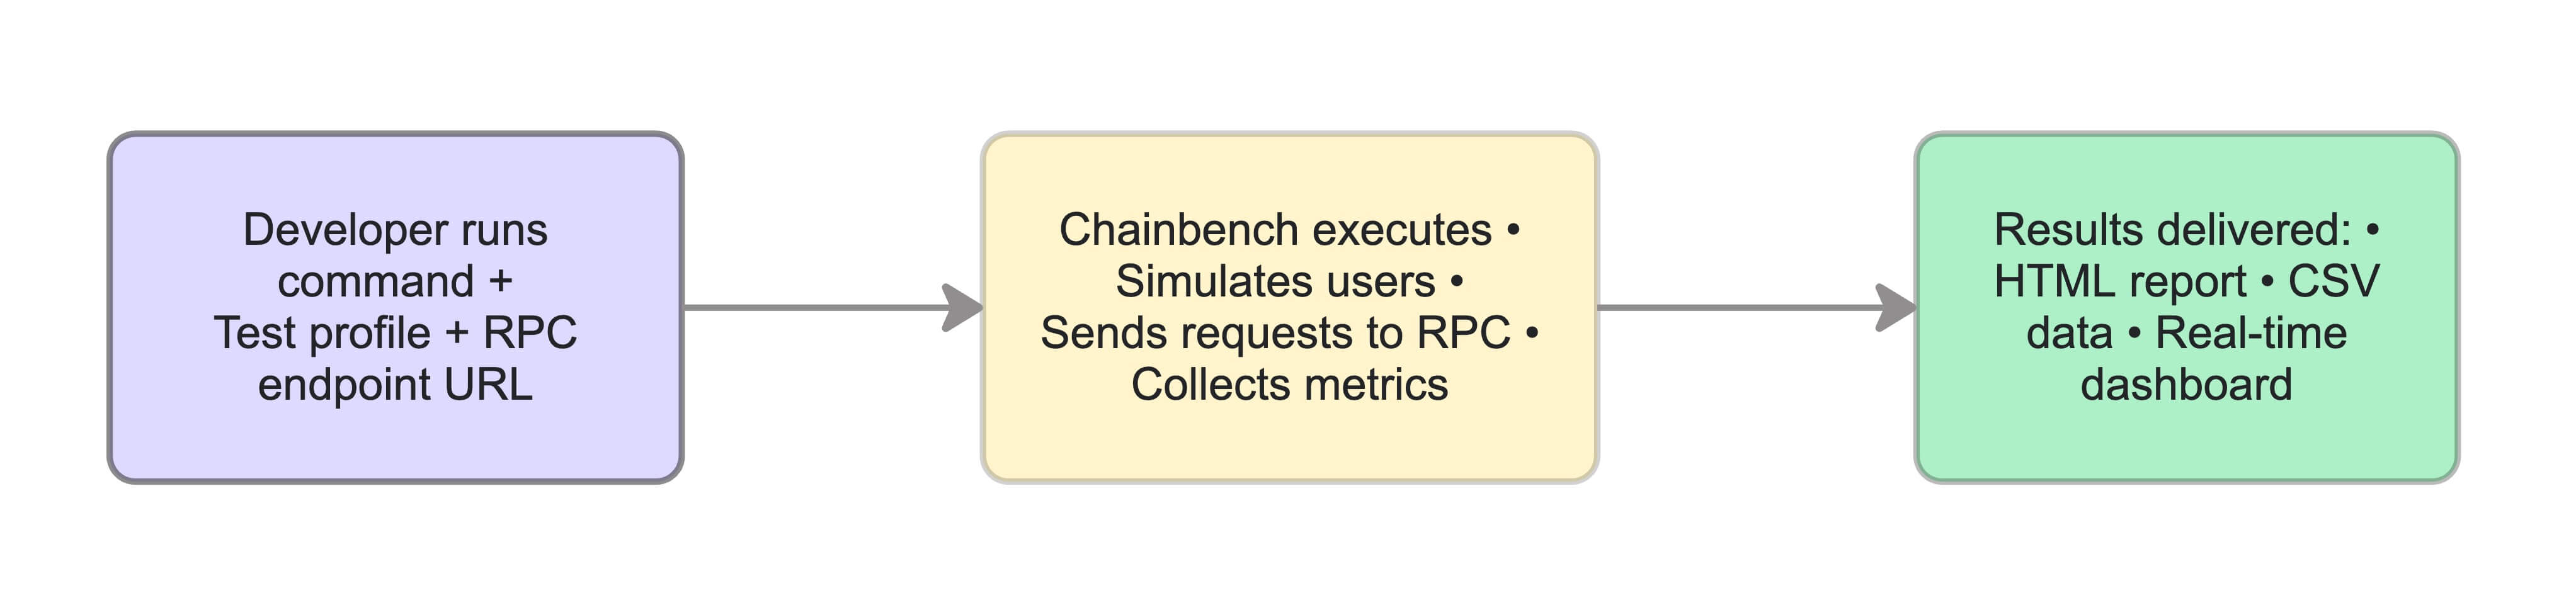
Chainbench is an open-source blockchain RPC benchmark tool that helps developers measure node performance under real-world conditions. It wraps a high-performance load generator (built on Locust) to simulate realistic blockchain traffic and reveal how nodes perform under stress.
Key features:
- Multi-chain support: Works with EVM chains (Ethereum, Solana, Polygon, BSC, Arbitrum, Base, and more)
- Built-in profiles: Pre-configured test profiles for each chain that simulate realistic traffic patterns with weighted method distributions.
- Realistic test data: Uses actual on-chain data (blocks, transactions, addresses) to generate test parameters that match real usage.
- Flexible testing modes: Run tests via command-line for automation or use the interactive web UI for real-time monitoring.
- Comprehensive metrics: Captures latency percentiles (p50, p95, p99), requests per second, error rates, and detailed performance breakdowns.
Chainbench is completely open source. This transparency allows the community to verify the methodology, contribute improvements, and establish it as a standard blockchain RPC benchmark.
See it in action
Let’s look at three common scenarios where Chainbench helps you make better infrastructure decisions.
Scenario 1: Quick performance check
You want to quickly test how fast your endpoint responds to a common RPC call. Install Chainbench and run a single-method test:
pip install chainbench
chainbench start eth_blockNumber \
  --users 50 \
  --workers 2 \
  --test-time 5m \
  --target https://your-endpoint.example \
  --headless --autoquit
This simulates 50 concurrent users continuously calling eth_blockNumber for 5 minutes. Within seconds, you’ll see requests per second, latency percentiles, and failure rates.
When to use this: Quick smoke tests, verifying endpoint availability, or testing a single method’s performance before production deployment.
Scenario 2: Realistic workload testing
Your app doesn’t just call one method—it makes a mix of requests: reading balances, fetching transactions, querying logs. Test with a profile that matches real-world usage:
chainbench start \
  --profile evm.light \
  --users 100 \
  --workers 4 \
  --test-time 10m \
  --target https://your-endpoint.example \
  --headless --autoquit
The evm.light profile mixes common read methods with realistic weights:
eth_blockNumbereth_getBalanceeth_getBlockByNumbereth_getTransactionReceipteth_call
Chainbench also includes chain-specific profiles (bsc.general, polygon.general, solana.general) and heavier profiles that test resource-intensive operations like eth_getLogs and debug traces.
When to use this: Performance validation before production, comparing multiple providers, or establishing baseline metrics for your infrastructure.
Scenario 3: Verifying method support
Before running extensive tests, verify which RPC methods your endpoint actually supports:
chainbench discover https://your-endpoint.example \
  --clients geth,erigon
This checks your endpoint against known method specifications for different node clients (Geth, Erigon, etc.) and shows you:
- ✓ for methods that work
- ✗ for unsupported methods
- Error codes for methods that return errors
When to use this: Validating new node deployments, auditing provider capabilities, or debugging unexpected method failures.
What the results look like
After each test, Chainbench generates a detailed HTML report showing:
- Latency distribution: Median (p50), 95th percentile (p95), 99th percentile (p99), and maximum response times.
- Throughput metrics: Total requests per second (RPS) across all methods.
- Error analysis: Failure rates and error types for each method.
- Time-series graphs: Performance over time to identify degradation patterns.
These metrics answer the questions that matter: Does my endpoint handle p95 requests under 100ms? What happens at 500 RPS? Where does it start failing?
The report also includes downloadable CSV files for further analysis or integration into your monitoring dashboards.
Advanced features for power users
Beyond basic load testing, Chainbench supports several advanced scenarios:
- Custom profiles: Create profiles that match your exact traffic patterns with custom method weights and timing.
- Load shapes: Test with step patterns (gradual ramp-up) or spike patterns (sudden traffic bursts) to simulate real-world scenarios.
- Sync lag monitoring: Track how far behind your node falls during load testing.
- Batch requests: Test JSON-RPC batch request performance with configurable batch sizes.
- Interactive web UI: Watch tests run in real-time, adjust parameters on the fly, and export results directly from the browser.
Getting started
Ready to benchmark your infrastructure? Here’s what you need:
- Python 3.10 or higher
- A blockchain RPC endpoint to test
- 5 minutes to run your first test
Install Chainbench and start testing:
pip install chainbench
chainbench --help
For a complete step-by-step guide covering installation, advanced usage, and custom profile creation, check out the official Chainbench tutorial in the Chainstack documentation.
Don’t have an RPC endpoint yet? Deploy one on Chainstack with support for 70+ protocols including Ethereum, Base, Solana, and more.
Conclusion
Blockchain infrastructure performance shouldn’t be a mystery wrapped in marketing speak. Chainbench provides the transparency and standardization the industry needs to make informed decisions about RPC endpoints. It sets the foundation for what an effective blockchain RPC benchmark should look like.
Use Chainbench to:
- Validate node performance before production deployment
- Compare providers with apples-to-apples benchmarks
- Test your infrastructure under realistic load conditions
- Establish baseline metrics for monitoring and alerting
- Automate performance testing in CI/CD pipelines
As a community-driven open-source project, Chainbench will continue to evolve with contributions from developers who need better tools for infrastructure testing. We invite you to try it, share your feedback, and help push the industry toward faster, more reliable blockchain infrastructure for everyone.
Power-boost your project on Chainstack
- Chainstack helps Web3 teams reduce infrastructure costs while scaling reliably across multiple blockchains. With transparent pricing and production-ready tooling, you can run RPC workloads without overpaying for unused capacity.
- Connect to Ethereum, Solana, BNB Smart Chain, Polygon, Arbitrum, Base, Tempo, Avalanche, Hyperliquid, Monad, Aptos, and more — all from a single platform designed for developers.
- Chainstack also provides fast access to archive data, Solana gRPC streaming, and public testnet faucets to support development and testing.
- Get started for free, explore pricing for your workload, or learn more in the Developer Portal.