AI-ready infrastructure
 Refer and earn


 Ethereum
 Hyperliquid
 Solana
 Arbitrum
 BNB Smart Chain
 Base
 Polygon
 TRON
 Sui
 Robinhood


Arc RPC provider scores for production DApps (November 2026)

Data sources: the Chainstack Compare scorecard and the 7-day RPC provider dashboard, both read on Nov 10, 2026. The scorecard shows no timestamp of its own.
Abstract
In these Arc RPC provider scores from the Chainstack Compare scorecard, for the Production dApp use case, Chainstack scores 83 out of 100, Quicknode 70 and Alchemy 56. The score rests on 81% of the scorecard's weight: the scorecard's six hand-compiled pillars plus Reliability and Performance, which this report computed from the 7-day dashboard because the scorecard left both unscored on Nov 10, 2026. Chainstack publishes the scorecard and is one of the three providers compared.
Key findings
- Score: Chainstack 83, Quicknode 70, Alchemy 56 out of 100, on 81% of the weight. Chainstack leads Quicknode by 13 points.
- Performance: mean regional P95 latency was 49.2 ms for Chainstack, 94.7 ms for Quicknode and 126.8 ms for Alchemy, which score 100, 94 and 84. Alchemy's Singapore P95 was 342.9 ms.
- Reliability: availability was 100% for Chainstack and Quicknode and 99.9132% for Alchemy, which scores 53 against 100 for the other two. This pillar rests on 40% of its sub-metrics.
- Cost: $2.62 per 1M requests on the Chainstack Growth plan, $12.37 on Quicknode Build and $14.46 on Alchemy Pay As You Go, which scores 73, 41 and 30.
- Where Chainstack does not lead: Enterprise (Quicknode 93, Chainstack 88), Support (Alchemy 26, Quicknode 23, Chainstack 12), requests per second on a roughly $50 plan (Alchemy 360 RPS, Chainstack 250 RPS, Quicknode 50 RPS) and gRPC and streams (Quicknode 100, Chainstack 0).
Verdict and best for
| Rank | Provider | Score | Gap to next |
|---|---|---|---|
| 1 | Chainstack | 83 | 13 points |
| 2 | Quicknode | 70 | 14 points |
| 3 | Alchemy | 56 | none |
| Best for | Provider | Evidence |
|---|---|---|
| Highest score on this scorecard | Chainstack | 83 out of 100, 13 points ahead of Quicknode |
| Highest Cost score | Chainstack | 73; $2.62 per 1M requests |
| Highest Performance score | Chainstack | 100 vs Quicknode 94 and Alchemy 84; 49.2 ms mean regional P95 |
| Highest Reliability score | Chainstack (tie with Quicknode) | 100 for both; Alchemy 53 |
| Highest Limits and RPS score | Chainstack | 85 vs Alchemy 59 and Quicknode 15, on 60% of the pillar |
| Highest Coverage score | Chainstack | 86 vs Quicknode 80 and Alchemy 75 |
| Highest Enterprise score | Quicknode | 93 vs Chainstack 88 and Alchemy 48 |
| Highest Support score | Alchemy | 26 vs Quicknode 23 and Chainstack 12 |
| AI-readiness | Tie | 79 for all three |
Bold marks the highest score in the row. A gap of less than 3 points is a tie under the scorecard's own rule.
Contents
- How the score is built
- Arc RPC provider scores: pillar table
- Provider summaries
- Arc RPC provider comparison by pillar
- Reliability and Performance from the 7-day dashboard
- Conclusion
- Appendix: weights and rules
- Other RPC providers
How the score is built
One score per provider: the scorecard's weighted mean over every scored pillar, using the Production dApp weights. Each pillar's weight is multiplied by its scored share, so a pillar with unscored metrics counts for less. Providers are ranked by score, highest first, and the order is the score order, not an editorial choice.
Limits
What the scorecard scored
- Publisher: Chainstack publishes the scorecard and is one of the three providers compared.
- Hand-compiled pillars: Cost, Limits and RPS, Coverage, Enterprise, Support and AI-readiness are compiled by hand from public pages. The scorecard says to confirm prices and limits with each provider.
- Scored share: the score rests on 81% of the weight. Unscored are Reliability freshness, correctness and the separate error-rate slot (15 points of weight) and behavior under a 2× spike in Limits and RPS (4 points). Behavior under a spike is a load-test metric the scorecard does not score.
What this report adds
- How the score was built: the scorecard scored six pillars, which carry 51% of the total weight. Reliability and Performance showed "Not scored: waiting for comparable fresh Grafana observations" on Nov 10, 2026, so both were computed here from the 7-day dashboard window read the same day, with the scorecard's published formulas. Reliability rests on availability alone, which counts for 40% of its pillar (10 points of weight). Performance rests on mean regional P95 latency, which counts for 100% of its pillar (20 points).
- Scorecard total: the six static pillars give totals of 73 for Chainstack, 54 for Quicknode and 46 for Alchemy, recomputed with the scorecard's formula. Those totals exclude live Reliability and Performance and differ from the scores in this report.
What the dashboard measures
- Scope: three probe regions (Frankfurt, US West and Singapore). The dashboard labels Alchemy and Quicknode as Growth plan and gives Chainstack no plan label. The dashboard measures no end-user latency and no correctness.
- Availability: request success, not time-based uptime. The figure is the mean of the three regional success rates from the scorecard's own measurements endpoint. The dashboard's single rate is 99.9132% for Alchemy and 100% for the other two, the same as the regional mean.
- Latency source: regional P95 values come from the dashboard snapshot. The measurements endpoint reports slightly different P95 values (mean 49.4 ms for Chainstack, 95.0 ms for Quicknode and 127.2 ms for Alchemy) with the same scores.
- Providers not scored: the dashboard also lists dRPC. The scorecard does not score it, so this report leaves it out.
How to read the numbers
- Rounding: displayed scores are rounded, so a 1-point difference between a recomputed and a displayed figure is expected.
- Ties: a gap of less than 3 unrounded points is a tie under the scorecard's own rule.
Arc RPC provider scores: pillar table
Chainstack scores 83, Quicknode 70 and Alchemy 56 out of 100 on the Production dApp weights.
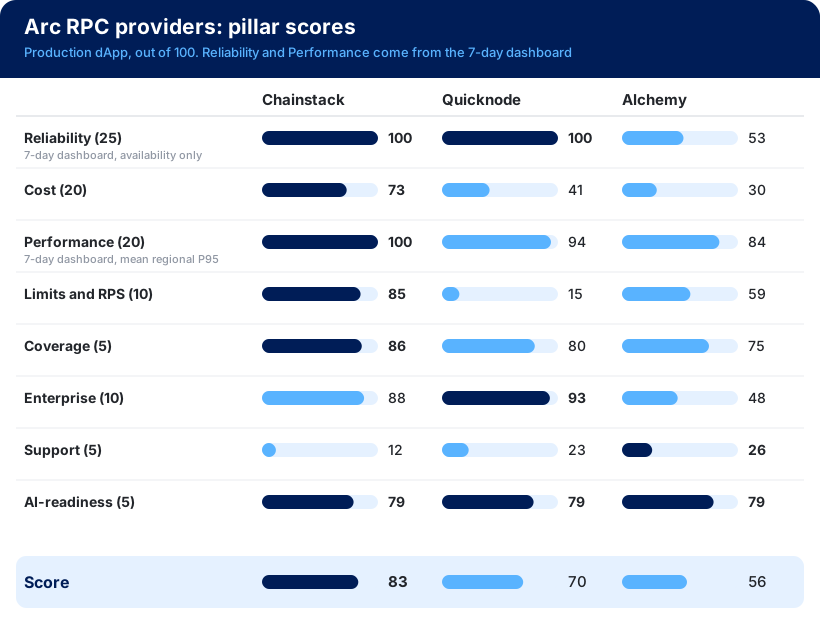
| Pillar | Weight | Scored share | Chainstack | Quicknode | Alchemy |
|---|---|---|---|---|---|
| Reliability (7-day dashboard, availability only) | 25 | 40% | 100 | 100 | 53 |
| Cost | 20 | 100% | 73 | 41 | 30 |
| Performance (7-day dashboard, mean regional P95) | 20 | 100% | 100 | 94 | 84 |
| Limits and RPS | 10 | 60% | 85 | 15 | 59 |
| Coverage | 5 | 100% | 86 | 80 | 75 |
| Enterprise | 10 | 100% | 88 | 93 | 48 |
| Support | 5 | 100% | 12 | 23 | 26 |
| AI-readiness | 5 | 100% | 79 | 79 | 79 |
| Score | 100 | 81% | 83 | 70 | 56 |
| Rank | 1 | 2 | 3 |
Higher is better in every row; bold marks the highest score, and every provider that ties. Rows marked "7-day dashboard" were computed for this report, and the rest are the scorecard's own values.
Provider summaries
1. Chainstack: 83 out of 100
- Best for: teams that weight Cost, Limits and RPS, Coverage and Performance.
- Strengths: highest score on Cost (73), Limits and RPS (85), Coverage (86) and Performance (100), and 100 on Reliability, tied with Quicknode.
- Trade-offs: Support (12, the lowest), Enterprise (88, below Quicknode's 93), no gRPC or streaming product (0), 250 RPS on a roughly $50 plan against Alchemy's 360 RPS, and a partial 50 on MEV protection and private transactions.
2. Quicknode: 70 out of 100
- Best for: teams that weight Enterprise, streaming and agent payments.
- Strengths: highest Enterprise score (93), 100 on gRPC and streams, 100 on agent self-serve and payments, and 100 on Reliability, tied with Chainstack.
- Trade-offs: Limits and RPS (15, with 50 RPS on Build at $49), Cost (41, at $12.37 per 1M requests), no disclosed MEV protection (0) and a 170.5 ms P95 in Singapore.
3. Alchemy: 56 out of 100
- Best for: teams that weight Support and requests per second on a roughly $50 plan.
- Strengths: highest Support score (26) and highest RPS on a roughly $50 plan (360 RPS).
- Trade-offs: Reliability (53, with 99.7805% availability in US West), Cost (30, at $14.46 per 1M requests), Enterprise (48, with no disclosed ISO 27001 or SLA percentage and under 90 days of status history) and a 342.9 ms P95 in Singapore.
Arc RPC provider comparison by pillar
Cost and pricing
Weight 20, fully scored. Lower is better for dollar figures; higher is better for scores.
| Metric | Share of pillar | Chainstack | Quicknode | Alchemy |
|---|---|---|---|---|
| $ per 1M requests, EVM dApp mix, compute only, 18.69M calls per month | 70% | $2.62 (Growth), score 72 | $12.37 (Build), score 26 | $14.46 (Pay As You Go), score 21 |
| Bill predictability | 20% | 100 | 100 | 70 |
| Archive, trace and history, $ per 1M (EVM indexer, compute only) | 10% | $10.65, score 30 | $13.32, score 24 | $19.97, score 12 |
| Pillar score | 73 | 41 | 30 |
Limits and RPS
Weight 10, 60% scored: behavior under a 2× spike needs a load test and is not scored. Higher is better.
| Metric | Share of pillar | Chainstack | Quicknode | Alchemy |
|---|---|---|---|---|
| RPS on a roughly $50 plan | 40% | 250 RPS (Growth, $49), score 77 | 50 RPS (Build, $49), score 23 | 360 RPS (Pay As You Go), score 89 |
| Behavior under spike (2× limit) | 40% | not scored | not scored | not scored |
| Flat-fee or unlimited RPS | 20% | 100: Unlimited Node, 25–500 RPS from $149 per month | 0: no self-serve option | 0: Enterprise from 1,000 RPS by contract |
| Pillar score (scored part) | 85 | 15 | 59 |
Coverage
Weight 5, fully scored. Higher is better.
| Metric | Share of pillar | Chainstack | Quicknode | Alchemy |
|---|---|---|---|---|
| Listed chain count | 30% | 98 (93 listed protocols) | 91 (77 catalogue chains) | 90 (75 mainnets) |
| Archive on this chain | 8.8% | 100 | 100 | 100 |
| debug and trace | 8.8% | 100 | 100 | 100 |
| WebSocket | 8.8% | 100 | 100 | 100 |
| gRPC and streams | 8.8% | 0: WebSocket only | 100: Streams on all plans | 50: webhooks on Pay As You Go |
| Dedicated nodes | 8.8% | 100: self-serve from Pro, from $0.50 per hour | 50: Enterprise only | 50: sales only |
| Region selection | 8.8% | 100 | 50 | 50 |
| MEV protection and private transactions | 8.8% | 50: optimized submission only | 0: not disclosed | 0: not disclosed |
| Testnets and faucet | 8.8% | 100 | 100 | 100 |
| Pillar score | 86 | 80 | 75 |
Enterprise
Weight 10, fully scored. Higher is better.
| Metric | Share of pillar | Chainstack | Quicknode | Alchemy |
|---|---|---|---|---|
| SOC 2 Type II | 25% | 100 | 100 | 100 |
| ISO 27001 | 10% | 100 | 100 | 0: not disclosed |
| SLA of 99.9% or higher with credits | 25% | 100: 99.9%, 10–25% credits | 100: 99.99%, Enterprise only | 0: percentage and credits not disclosed |
| SSO, RBAC and audit log | 15% | 67: audit log not documented | 100 | 100 |
| Single-tenant and jurisdiction | 15% | 50 | 50 | 50 |
| Status page with 90 days or more of history | 10% | 100 | 100 | 0: history under 90 days |
| Pillar score | 88 | 93 | 48 |
Support
Weight 5, fully scored. Higher is better. Chainstack has the lowest Support score.
| Metric | Share of pillar | Chainstack | Quicknode | Alchemy |
|---|---|---|---|---|
| Response time, roughly $50 plan | 50% | 0: "< 24 h", 24×5, 72 h worst case | 18: "24-hour SLA" | 18: 24 h |
| Response time, roughly $500 plan | 30% | 0: "< 24 h", 24×5, 72 h | 46: "8-hour SLA" | 18: 24 h |
| Channels and coverage | 20% | 60: add-on only for 24/7, Slack or Telegram and a manager | 0 | 60 |
| Pillar score | 12 | 23 | 26 |
AI-readiness
Weight 5, fully scored. Higher is better. All three providers score 79.
| Metric | Share of pillar | Chainstack | Quicknode | Alchemy |
|---|---|---|---|---|
| MCP, 5 reference tasks | 35% | 80: 4 of 5 | 40: 2 of 5 | 40: 2 of 5 |
| Docs for LLMs | 25% | 100 | 100 | 100 |
| Machine-readable pricing | 15% | 100 | 100 | 100 |
| Skills and plugins (90 days or less) | 10% | 50: update date not disclosed | 100 | 100 |
| Agent self-serve and payments | 15% | 40: no x402 | 100 | 100 |
| Pillar score | 79 | 79 | 79 |
Reliability and Performance from the 7-day dashboard
These two pillars come from the 7-day dashboard, window Nov 3, 2026–Nov 10, 2026, and were computed with the scorecard's published formulas. The dashboard shows no flag and no degraded metric for Arc.
Reliability
Weight 25, availability only (40% of the pillar). Higher is better. The score is 100 at 99.99% availability or above.
| Provider | Frankfurt | US West | Singapore | Mean availability | Score |
|---|---|---|---|---|---|
| Chainstack | 100% | 100% | 100% | 100% | 100 |
| Quicknode | 100% | 100% | 100% | 100% | 100 |
| Alchemy | 99.9963% | 99.7805% | 99.9628% | 99.9132% | 53 |
Performance
Weight 20, P95 latency only (100% of the pillar). Lower is better for milliseconds, higher is better for the score. The score is 100 at a mean of 80 ms or below.
| Provider | Frankfurt P95 | US West P95 | Singapore P95 | Mean regional P95 | Score |
|---|---|---|---|---|---|
| Chainstack | 48.9 ms | 50.1 ms | 48.5 ms | 49.2 ms | 100 |
| Quicknode | 17.9 ms | 95.6 ms | 170.5 ms | 94.7 ms | 94 |
| Alchemy | 19.5 ms | 18.0 ms | 342.9 ms | 126.8 ms | 84 |
Chainstack has the lowest mean regional P95 and the lowest P95 in Singapore. Quicknode has the lowest P95 in Frankfurt and Alchemy the lowest in US West, so Chainstack's lead comes from consistency across regions, not from the best latency in each one.
Conclusion
In these Arc RPC provider scores, Chainstack has the highest score on this scorecard for the Production dApp use case: 83 out of 100, 13 points ahead of Quicknode at 70, with Alchemy at 56. The score rests on 81% of the weight, with spike behavior, freshness and correctness unscored.
Per-pillar picks, for readers who weight the pillars differently:
- Cost: Chainstack, 73, at $2.62 per 1M requests.
- Performance: Chainstack, 100, at 49.2 ms mean regional P95, against 94 for Quicknode and 84 for Alchemy.
- Reliability: Chainstack and Quicknode tie at 100 on availability alone, and Alchemy scores 53.
- Limits and RPS: Chainstack scores 85 on the scored 60% of the pillar, while Alchemy has the highest requests per second on a roughly $50 plan (360 RPS against 250 RPS).
- Coverage: Chainstack, 86, ahead of Quicknode at 80 and Alchemy at 75. Chainstack scores 0 on gRPC and streams against 100 for Quicknode.
- Enterprise: Quicknode, 93, against 88 for Chainstack.
- Support: Alchemy, 26, against 12 for Chainstack, the lowest.
- AI-readiness: a three-way tie at 79.
Teams that need a production DApp provider on Arc should read the Enterprise and Support rows before the headline, because those are the two pillars where Chainstack scores below a competitor.
Appendix: weights and rules
Production dApp weights: Reliability 25, Cost 20, Performance 20, Limits and RPS 10, Enterprise 10, Coverage 5, Support 5 and AI-readiness 5, a total of 100.
- Score: the sum of weight × scored share × pillar score, divided by the sum of weight × scored share. Here the divisor is 81.
- Performance: 100 when the mean regional P95 is at most 80 ms, 0 at 1,500 ms or more, and otherwise 100 × ln(1500 / m) / ln(1500 / 80).
- Reliability: 100 when availability is at least 99.99%, 0 at 99% or below, and otherwise 50 × (−log10(1 − availability) − 2).
- Pillars read from the scorecard: Cost, Limits and RPS, Coverage, Enterprise, Support and AI-readiness, as the scorecard displayed them on Nov 10, 2026.
Other RPC providers
The scorecard scores only the providers in this report. These Chainstack lists cover others: